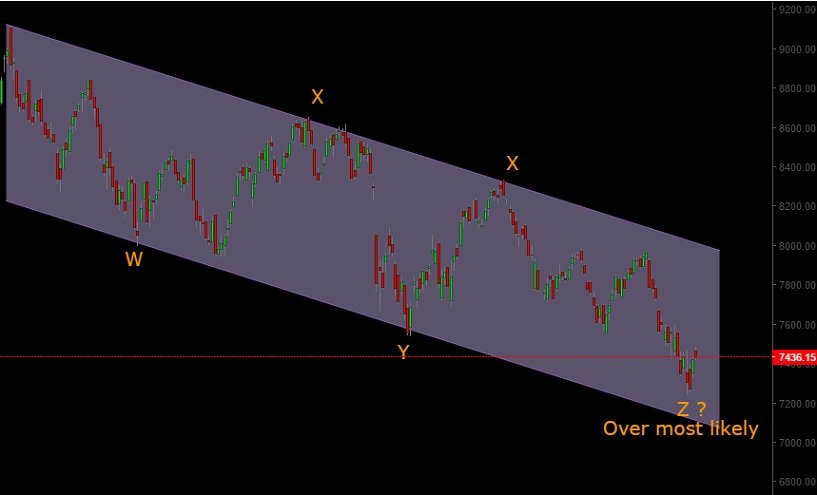
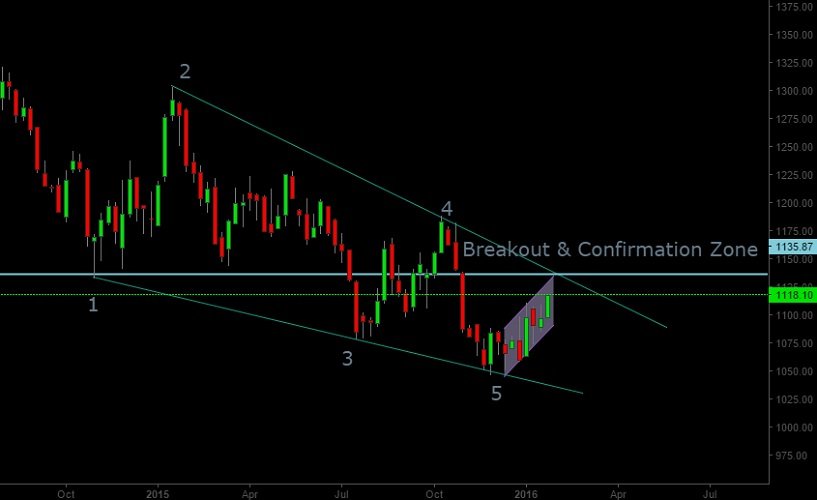
Our 21st January market end report pointed out to a reversal in the market with an immediate price target of 7580-7630 for the ending diagonal pattern. The trade is currently in play. Meanwhile we present a medium term chart outlining a high probability wave count for the correction this market has endured from March 2015. Chart below:
[sociallocker]
 [/sociallocker]
The chart indicates that the Z-wave is most likely over, considering the last leg of this z-leg has seen a 5-wave move develop ending in an ending diagonal pattern, as per our short term wave count. The implications are we may probably be in early stages of a bull market (as per the high probability wave count).
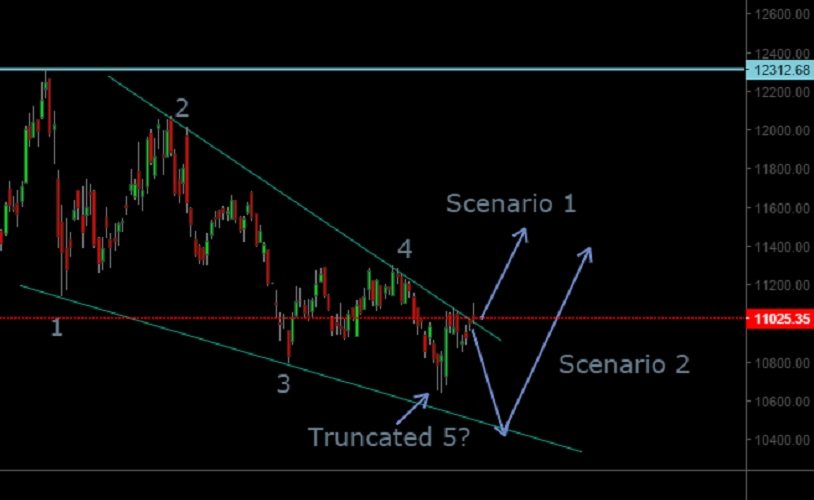
This has been further reinforced by our 26th Jan report regarding developments in Nifty IT Index, which has indicated a completion of reversal pattern and has already confirmed a break above 2-4 line, indicating the long term correction in index that has been in play since March ’15 might have ended, chart reproduced:
 [/sociallocker]
Meanwhile our 14 Dec report on Gold indicated a major rally imminent in Gold. Gold has since rallied substantially and is very close to the trend line, a break of which would confirm the long term implications of the pattern. If prices break above the 2-4 trend line outlined in the chart below, it would confirm the pattern and thereby activate the 2016 targets mentioned in our report. The short trend channel drawn in the chart would only be able to contain the price action from the December lows if the movement is corrective. If the prices move above the 2-4 trend line and the upper end of the trend channel, their would be little doubt on implications of our analysis from 14-December:
 [/sociallocker]
We have the first Fed meet since the famed rate hike on 16th Dec. ongoing. We picked up the yield charts for the U.S. treasuries to see what they imply. Starting with the short term 2 year yield chart. The optimism (or scare) for further rate hikes after 16th December was short-lived, which is indicated by how markets turned in just few days, so much so that now they are trading more than 15 bps below the levels they were trading at the end of 16th December.
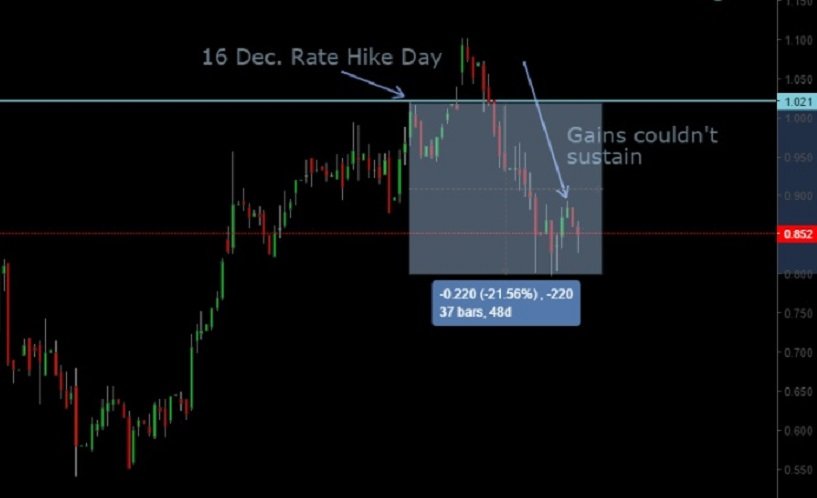 [/sociallocker]
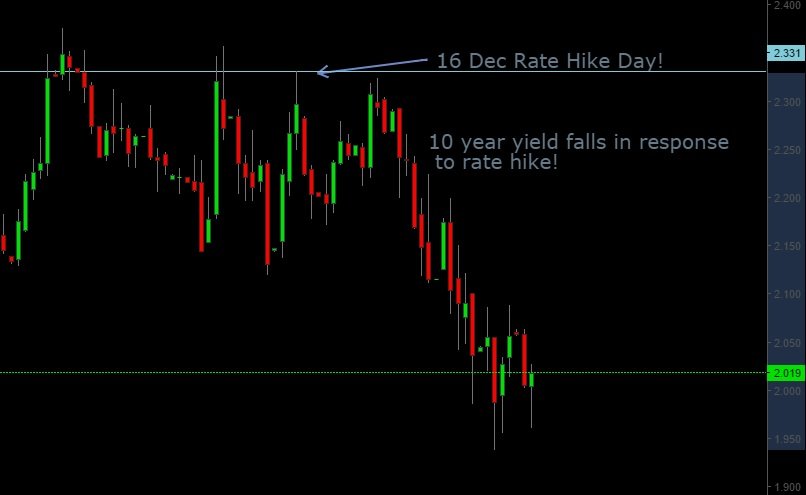
As far as further rate hikes are concerned, it is priced out of the markets, but one needn’t have picked the chart to discern that considering the panic sell-off we have witnessed recently. The question on the contrary is can Fed do an ECB and volte-face on their rate hike or would they persist with their stance? The 2-year charts might not provide much help in answering that but what we have seen on the long term yields (10 year yields) is totally mind-blowing. Not only did the 10 year yield fail to trade above their highs on 16-December, today they are trading lower by close to 30 bps.
While this may still not be enough to force a volte-face, considering how crucially poised Gold and stocks are for a bullish move, [sociallocker]it is very likely the outcome of the meeting could at least be half a volte-face. In the past Fed has implied rate cuts, QE, operation twist, agency mbs purchases as tools to stimulate economy and while this has just managed to push financial markets higher, one can hardly say what rabbit they may pull out of their hat. But the way price action in markets are poised , even a dovish commentary might be just enough for Indian equities and Gold to push substantially higher.[/sociallocker]