Marubozu candles are simple, easy to spot candles that indicate strong move in either direction (up or down). In this post I’m going to cover the details about Marubozu candles and more generally about strong white and black candles. I will share:
- Basics of Marubozu Candles (White & Black)
- Different Types of Marubozu Candles
- Trading Implementation – How to use Marubozu or any strong white/ black candle in your trading
- Sample Trading System
Let’s get started
Marubozu Candle – Basics & Types
Marubozu white candles are those candles where:
- Close Price > Open Price
- Trading Range of the candle is > Average range of candles in that time frame
- Close Price = High Price
- Open Price = Low Price
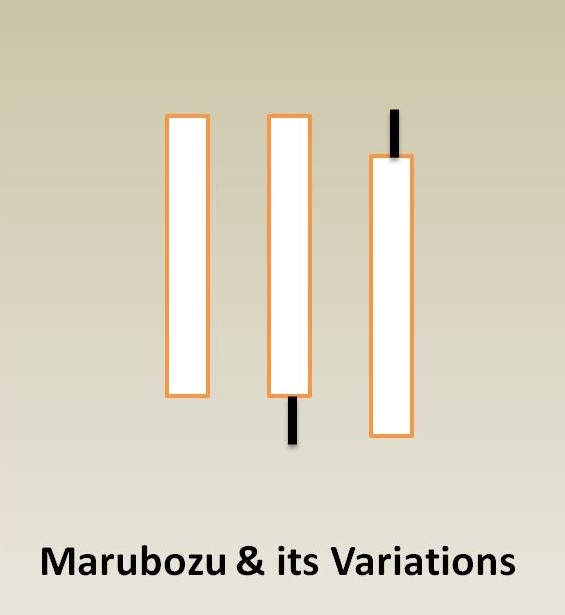
Marubozu white candle indicates that the buyers are in total control. This is because markets open at the low price of the day and close at the high price of the day. The movement is significant as indicated by the size of candle’s daily range – which should be higher than the average range of daily candles. The average range of candles can be determined by using the 14-period ATR (Average True Range). This indicator is easily available on most charting platforms.
The two simple variations of Marubozu white candles are also shown in the diagram. They are candles where either closing price is not equal to high price or open price is not equal to low price. The interpretation of these candles is the same.
Like we have the Marubozu white candles which indicate strong bullish price action we also have the Maurbozu black candles which indicate strong bearish price action. The conditions for Marubozu black candle is as follows:
- Close Price < Open Price
- Trading Range of the candle is > Average range of candles in that time frame
- Close Price = Low Price
- Open Price = High Price
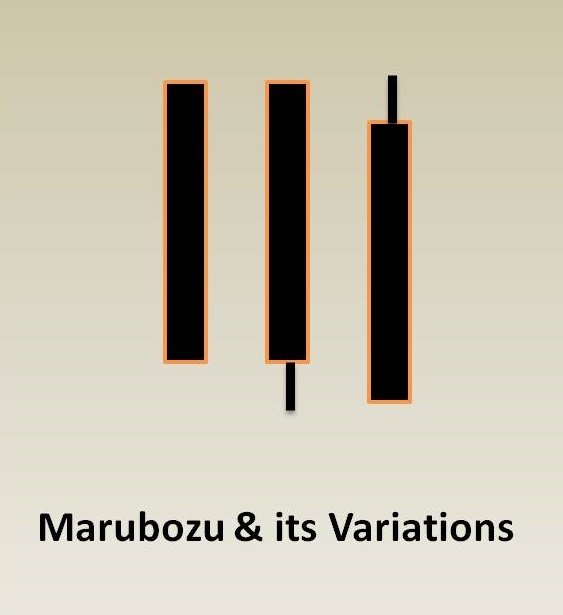
Marubozu black candle indicate that the sellers are in total control. This is because markets open at the high price of the day and close at the low price of the day. The movement is significant as indicated by the size of candle’s daily range – which should be higher than the average range of daily candles. The average range of candles can be determined by using the 14-period ATR (Average True Range). This indicator is easily available on most charting platforms.
The two simple variations of Marubozu black candles are also shown in the diagram. They are candles where either closing price is not equal to low price or open price is not equal to high price. The interpretation of these candles is the same.
Trading Implementation – 1
We will here discuss how we can use Marubozu candles – and more general any long white or black candle for our trading – By long candle we mean a candle with a long body – with wicks smaller than the body of the candle. Also the range of the candle should be greater than the 14-period ATR
Long candles signify significant breakout from a support or resistance zone if: 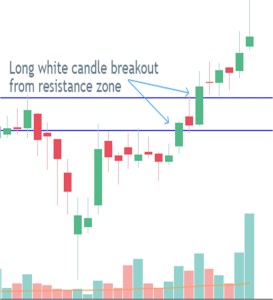
a. the breakout is accompanied by high volume &
b. if it appears after a consolidation of some kind
On right is an example of significant breakout using the long white candle. The first breakout occurs after a consolidation spanning 7-8 candles. The next breakout is of a comparatively longer term resistance level. Both breakouts happen on volumes above the average volume. You can use 50 days average volume for your analysis.
You see how both breakouts were sustained with minimal pullbacks. The concept can be similarly applied for long black candles.
Trading Implementation – 2
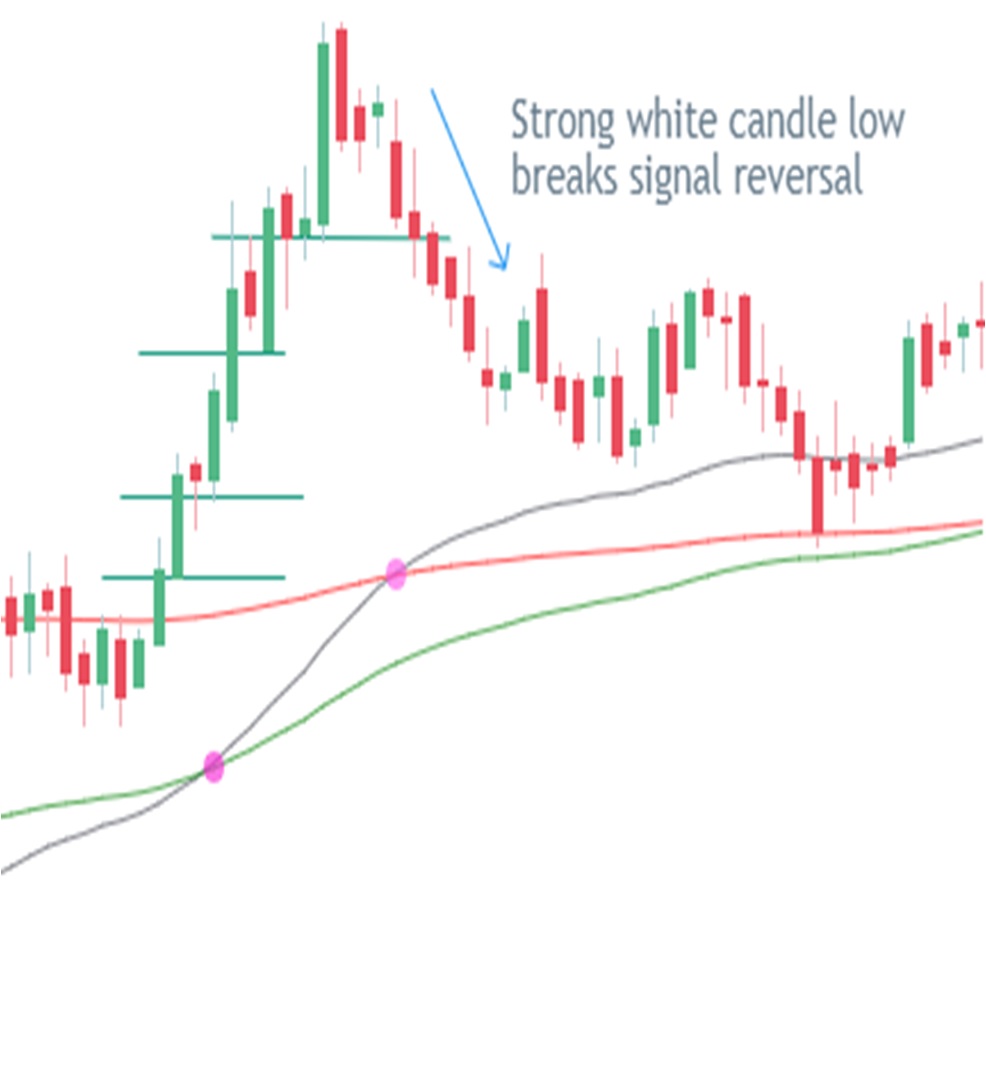
Long white candles may signify reversal of trend.
For example on the right we see that there are a number of long white candles in the up-move, each of these white candles reinforce the strong existing up-trend because they signify strong buying during the uptrend.
Now if you see that prices are suddenly able to move below the lows of any of these candles – it should tell you that something has fundamentally changed about the trend and the trend may have reversed. In the diagram we see how once this happens prices continue to keep falling. The concept can be similarly applied for long black candles
Sample Trading System
Next let’s see how you can create a sample trading system using the concepts you learnt so far. Note like with any candlestick pattern you should first back-test the trading strategy before trading it in real market. This is a separate topic that I’m not going to get into in this post. Here I’m outlining a strategy just to show you how you can apply the concepts you learnt here.
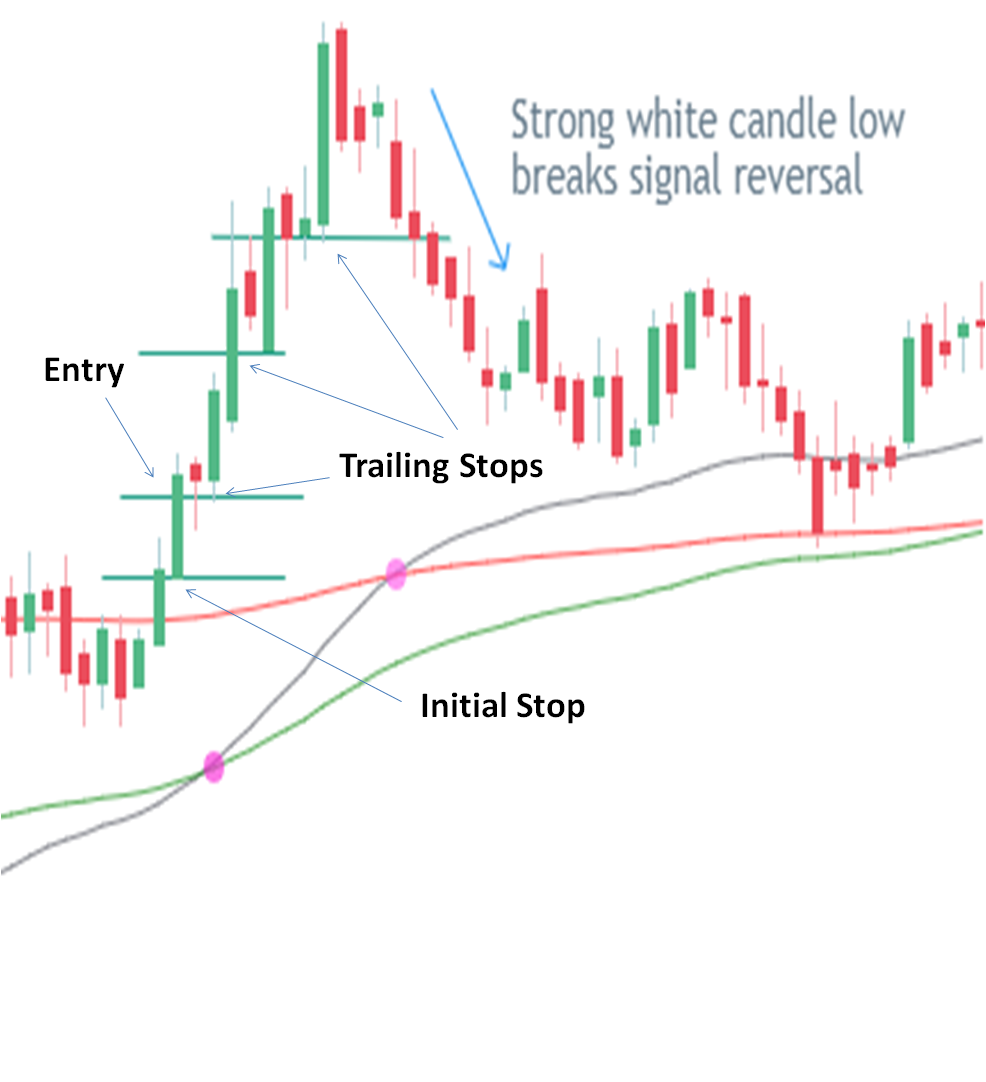
In the diagram on the right I have shown how you can enter a trade around close of a strong white candle – In this case a Marubozu candle. The prices are coming out of a consolidation of few days and break above the recent highs with a Marubozu candle. Note the above average volume (not shown) indicating strength in prices ahead. You can place an initial stop loss just below the low of this candle. Once prices move in your favor you can keep trailing stops at subsequent long white candles. Once prices break below one of these trailing stop losses you exit the trade and book your profits.