We came across this chart today and would like to alert our readers to an impending trading opportunity in Divi’s Labs. The chart below shows a triangle formation in price charts. A triangle formation can be broken down into 5 legs and we are likely seeing the 5th leg in action.
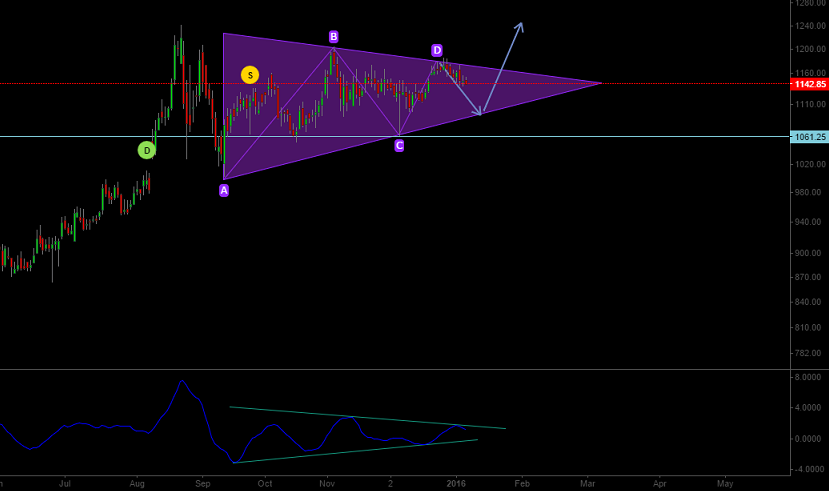
The first four leg are marked as A-B-C-D and currently we are in what looks like the 5th leg. As part of this 5th leg the prices should drift lower closer to the lower trend line A-C and take support along this trend line. It should also be noted that each leg of this triangle managed to retrace more than 61.8% and sometimes more that 78.6% of the previous leg. Based on a similar calculation for wave E we may see the prices falling in the 1089-1095 region. Once this E wave is complete we should see a rally which should take prices above the trend line marked as B-D with 1st target around 1240. This triangle pattern would be in-validated if the prices fall below the lows of the C wave which comes to around 1061.8 (on NSE). In case the E-leg falls short and doesn’t reach the A-C line then a trade should be initiated on the break of B-D line with stop loss below the end of wave E. This scenario would indicate that the rally post completion of this setup will be strong and the prices can be expected to move significantly above 1240 (We will post a revised target if this scenario unfolds).
Bottom line: We recommend to initiate the trade when the prices near the trend line A-C, with a stop just below 1061.8 for a target of 1240. The beauty of this trade is that the profit-loss ratio works out close to 5:1 with clear stop loss so that you can limit your losses.
Disclosure: At the time of publication of this post, we are not registered with SEBI as a research analyst. Our analyst has an application for registration as a research analyst with SEBI pending at the time of publication of the post.