You can watch our latest update on youtube or read the transcript below:
Transcript:
In our last youtube video we talked about two scenarios. Our assumption of the then price action being part of an ending diagonal pattern was nullified on break of 10830-840 levels. As outlined in our video, we expected the markets to make new high on break of these levels and the price action since has been very swift.
Now that we are very close to our upside targets, it’s a good time to look at the price structure to determine whether the second part of our forecast can play out. Here is the chart of Indian Nifty with elliott wave labels:
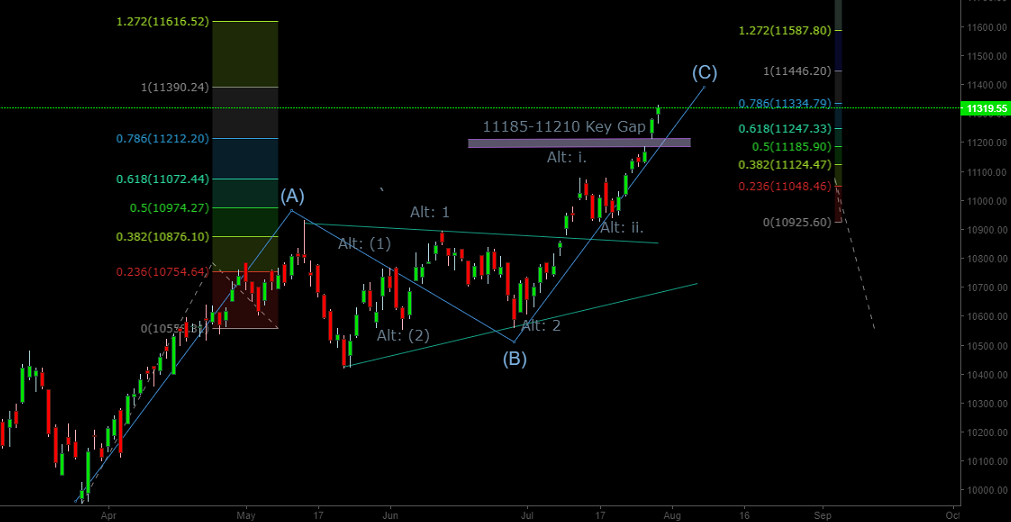
In this chart I have shown our primary assumption marked as (A)-(B)-(C), that came into play once the crucial 10830-840 level were taken out. The measure target for (C)-wave (where wave (A) = (C) in amplitude) under this assumption was around 11390-11400. We made a high of 11334 away which is now only around 0.5% away. If indeed our assumption is correct, then we should expect the prices to reverse soon and Nifty and Sensex should decline in 5-waves taking them below their march lows. Interestingly the Fibonacci time analysis indicates August 2 to be an important time level. So a short term trend change may be expected around this time, specially considering that we have the RBI meeting on August 1 as well. This was the base scenario outlined in our last video as well.
However, the beauty of using elliott wave theory is that it allows you to use latest information to confirm your assumptions before you act. In this scenario for example, we should also take into account the price structure from June 28 lows (where we assume our wave C starts). A look at this price substructure tells us that this price structure looks more bullish than we would like. If we count this price structure of wave C as 1-2-3-4-5, the wave 5 looks much longer compared to wave 1 and is in fact now very similar magnitude as wave 3, and while this is not a violation of any of the 3-rules within elliott wave theory, such a bullish price action alerts us to be open to other possibilities and wait for confirmation before acting on our assumed wave count.
In the chart above I have outlined another wave count that I’m tracking. This wave count has prefix Alt attached. This alternate wave count would put the current price to be in wave 3 at multiple degrees which would imply higher levels for Nifty. There is also a gap price action (11185-11210) as part of this wave 3 which was created on 27th of July. Now, this price gap action can be really helpful for us in determining which wave count to trust.
Typically considering that the alternate wave count assumes that we are in wave 3 at multiple degrees, this price gap should not close at least in the near term. In fact if we see prices reversing and closing the gap it would be the first signal that our base case scenario is playing out, and we would look at the price structure of the decline (if it happens) to further confirm our assumption.
Conclusion: We will continue with a carefully bullish bias as long as prices stay above the gap zone of (11185-11210) and wait for a declining price structure to confirm our base case scenario.
One thought on “NIFTY & SENSEX Update”
Comments are closed.


Your Elliot Wave Analysis is really superb