Relative Strength Index or RSI is a very well known technical indicator known to almost everyone. This is thanks to it being quoted very often in mainstream media. One reason why retail investors like this indicator is because it is easy to use it as a thumb rule. As investopedia puts it:
“RSI readings above 80 indicate overbought conditions and RSI readings below 20 indicate oversold conditions”
Some experts say that one shouldn’t follow the values in this thumb rule strictly. Instead, one should observe the behavior of this indicator for each stock/ security separately. The investor should then determine the appropriate values for this indicator to generate overbought/ oversold signals.
Another use of this indicator is as a divergence indicator. Essentially when prices & the indicator diverge, there is a high probability that the trend is unlikely to continue.
A much less discussed aspect of this indicator is how this indicator should be utilized depending on the state of the market. For example one cannot assume that an up move will exhaust just because this indicator hits the overbought zone. In fact it is very common to find that in a strongly trending market the prices can continue to rally even after the indicator have hit overbought levels. So, just relying on this indicator in such scenarios becomes misleading. In a range-bound market however the overbought / oversold signals from this indicator are much more reliable.
Here we are outlining an example of how we can utilize this indicator in another way. We can do this by observing the pattern formed within the indicator (in conjunction with price). Lets look at the current Nifty chart:
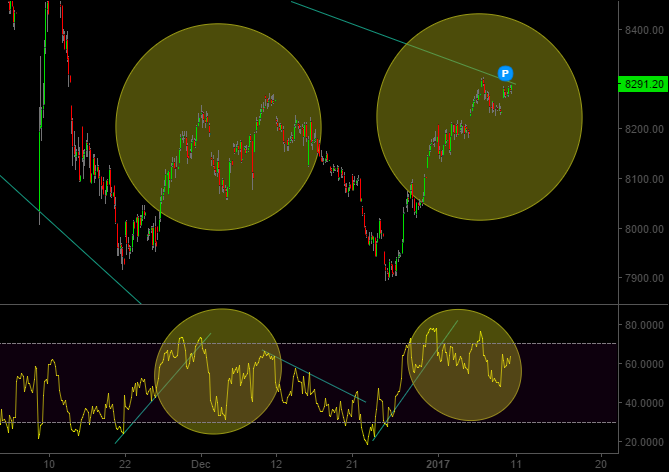
This is the 60 min-chart of Nifty. If one looks at the price action in first half of December & compare it to the action in Late December-January, there is a high degree of similarity. This is true for both the Nifty price and also the RSI values. In both cases as the Nifty entered matured stage of their short term trend, RSI values hit the overbought zone twice. This was followed by a correction (in both Nifty & RSI). The next attempt by Nifty manage to make a new high but RSI values didn’t follow (resulting in a divergence). We are again seeing a similar attempt by Nifty as it attempts to breach the Jan 6 high of 8306. We won’t be surprised if there is a strong similarity in the move in the coming days as well.
Considering the possibility of Nifty breaching the Jan 6 high of 8306, we don’t recommend going short immediately. But we should definitely be looking for surprises to the downside. There is every chance that we may see a substantial down move begin anytime now. The upside for the current move should be limited to the levels mentioned by us in the Nifty short term outlook section of our 2017 Financial Markets Forecast.