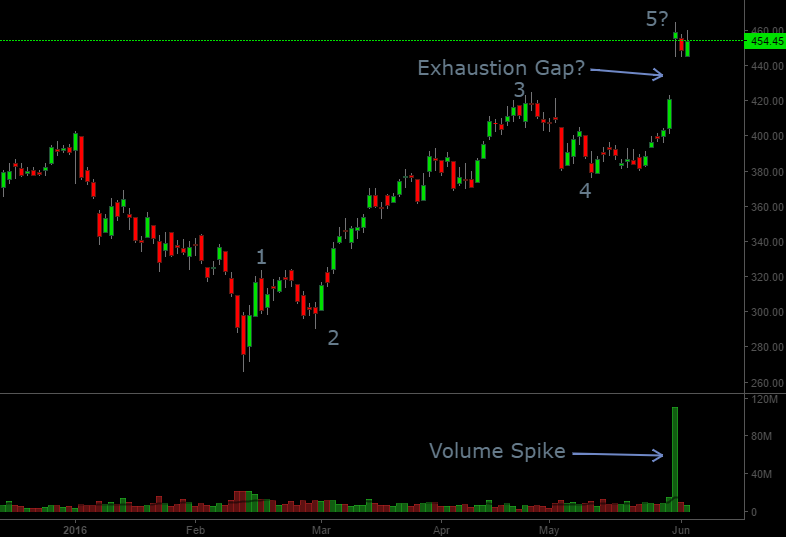
Tata Motors rallied by close to 3% on intraday basis which may entice many to jump into the ‘uptrend’. To be sure we have seen Tata Motors rally by close to 75% from its Feb lows. So one can be sure we have a substantial uptrend in place.
On 31st May there was a sharp spike in volume. This was accompanied by prices opening gap up. All this was probably in response to the results that came out on the 30th evening. Great results = Great returns? At least that is the sense one gets from the following news articles :
Tata Motors jumps after posting stellar Q4 results
Tata Motors Q4 net surges three-fold at Rs 5,177 cr
But this has the potential to be an investor trap. Have a look at the daily chart of Tata Motors:
Notice how on 31st May there was a gap up opening involving sharp spike in prices accompanied by a stellar spike in volume. This gap action is potentially an exhaustion gap (You can watch this short video from our Technical Analysis Course to learn about exhaustion gaps: Exhaustion Gap Video). Exhaustion gaps entail trend reversals which may result in major consolidations or reversals. Usually one expects the exhaustion gap to be filled.
Also we may be probably in the 5th wave of the uptrend as labeled in the chart above. This raises the odds that this exhaustion gap will be filled. Also given the fact that this correction would develop after a probable 5th wave completion we may actually expect the prices to fall much further. But it is very likely we may soon see Tata Motors falling to 424 and probably 400/375 levels.
So even if you are otherwise ‘fundamentally’ bullish on the counter it would be wise to wait and see if this materializes. The only caveat with applying this technique to a blue chip stock like Tata Motors, is that the best of institutional traders trade in such stocks. Which means they try to preempt what other small traders may be looking at. In case of exhaustion gaps for example the prices shouldn’t exceed the 31st May highs (465). We could have reliably trusted this stop loss if it occurred in a lesser known stock. But this being a blue chip, in the short term a stop loss placed just above the 31st May high may not be reliable as institutional traders might try to take out the stop loss before the downward move materializes. However the chances are still high that one might see levels of 400/375 before a substantial sustainable rally develops in this stock again.
You can learn many such patterns which can potentially save you a lot of money by trying our technical analysis course. You can check it out here: Technical Analysis Primer for trading Stocks, Bonds & Forex


