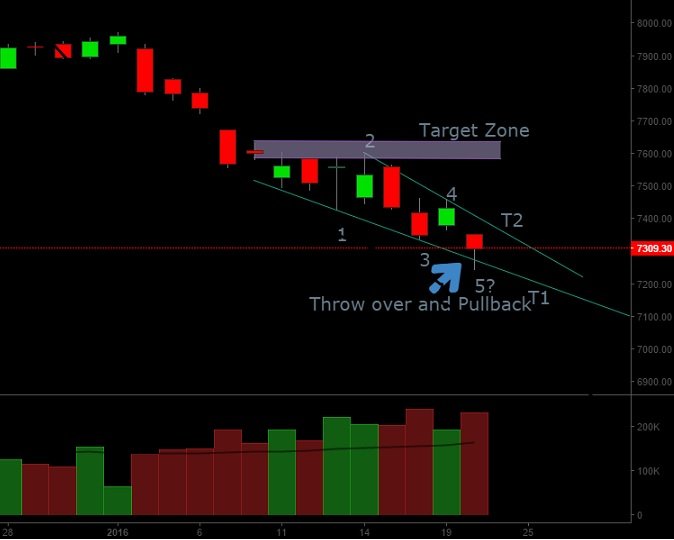
Nifty opened gap down 80 points and ended sharply lower today down by over 1.5%. At one point it was trading down close to 200 points, but ended up recovering some losses by the day end. We have been tracking this pattern for few days now, but this pattern requires at least 3 to 4 legs to be complete before we can delineate the pattern and look for confirmations for pattern completion. We have often referred to this pattern in our post(s) on Gold and Dollar Index. The pattern is the ending diagonal pattern or the wedge. We are seeing the same pattern on Nifty charts:
An ending diagonal triangle, or wedge as many call it, is a narrowing price move composed of two converging trend lines highlighting a wave 5 or wave C pattern. The two converging trend lines (T1 and T2) provide important guidance with respect to confirming this pattern. Sometimes prices do fall below T1 in one final burst of impulsive move, which looks like a throw over before prices quickly reverse back to close over T1. We have seen a similar throw over action in prices today as the prices broke below T1 but ended up recovering to close above T1.
The pattern is confirmed and said to be in play once the prices break above the upper trend line (T2). The beauty of this pattern is that it gives a clear price target for prices once it is in play. Once the prices break above T2 it is expected that the prices will rise to the start of wave 1 of the pattern. This implies a target of 7580-7630 for the pattern.
In context of the current long term scenario, the nature of this move (if it materializes) would give us a good indication if we have a medium term/ long term bottom in place. Specifically if this upward move develops in a corrective fashion we can expect another sell-off. If not, we may be looking at a substantial medium and possibly a long term bottom in place.


3 thoughts on “Nifty: Possibly Ending diagonal pattern completion today”
Comments are closed.