An ending diagonal triangle, or wedge as many call it, is a narrowing price move composed of two converging trend lines highlighting a wave 5 pattern. An ideal ending diagonal is reproduced below:
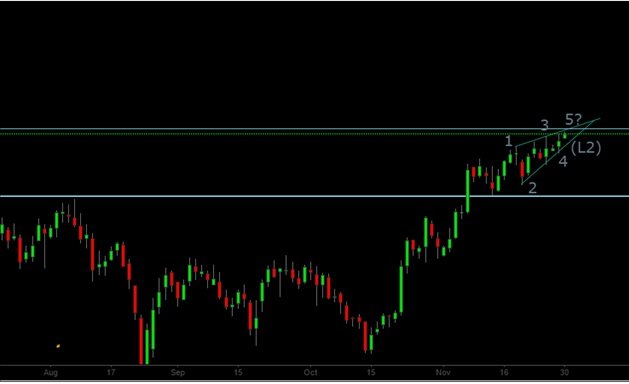
We are likely seeing this pattern unfold on the dollar index charts (1-2-3-4-5 wave count in the chart below). In light of this the recent high of 100.37 on DXY is very likely to hold. This should entail a consolidation in the dollar index with the index likely to fall to the start of the ending diagonal pattern which would be the level of 98.42. We await confirmation that the ending diagonal pattern has ended, which would happen only once the index breaks the lower trendline (L2 shown below) of the diagonal pattern.
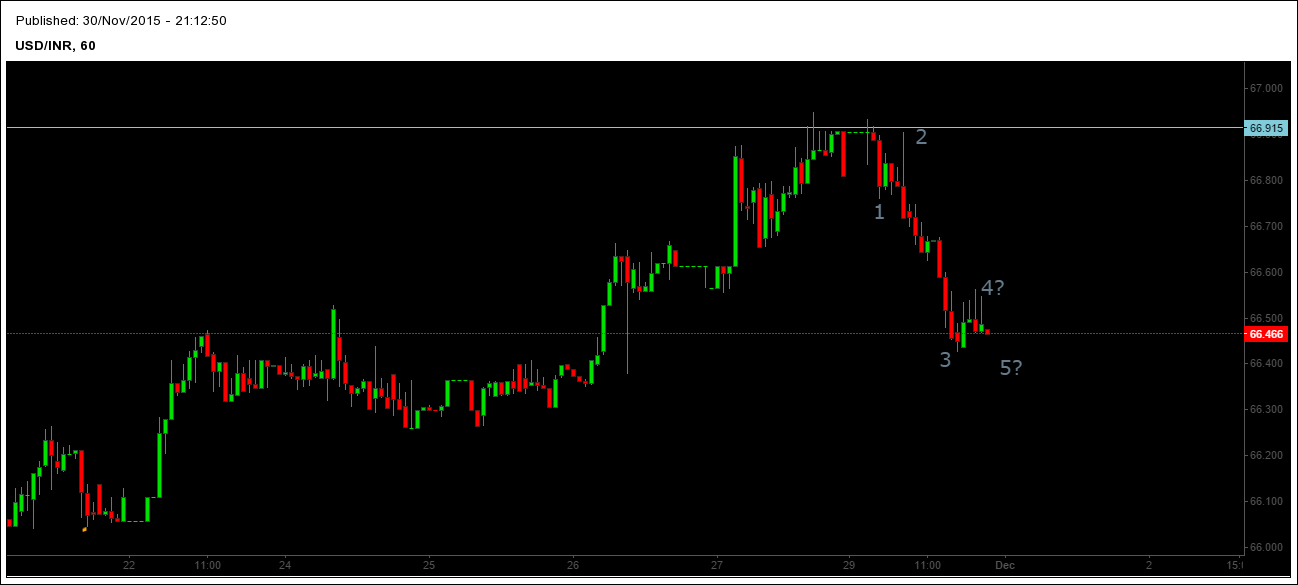
USDINR The hourly chart of USDINR is probably evolving into a downward 5 wave movement. Based on our article published on Oct 11, USDINR approaches make or break level, the currency pair has already come very close to our target levels around 67. This followed by the recently evolving 5 wave downward movement on the hourly chart indicates that the recent high of 66.91 made by the currency pair might hold up for the short term, and after a brief pause in fall we should expect a much deeper fall and we should expect a reasonable short term target of 65.85 for the currency pair.