As explained in our last post we expected Nifty to rally towards the 9473-9500 zone. We also expected some kind of correction to develop from this zone. However, we also mentioned that we cannot rule out the possibility that wave 3 (which we showed as a 9-wave extension), may develop in to a 13-wave extension. Here is the 15-minute chart of Nifty after our last update:
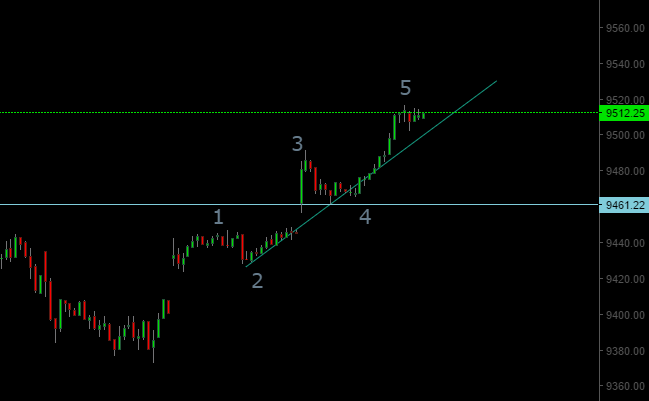
We can label the move over the last 2 days as shown in the chart. Notice how wave 3 is visually shorter than wave 1. Remember as per Elliott wave theory there are three rules that should never be violated for an impulse wave. They are:
- Wave 2 never retraces more than 100% of wave 1
- Wave 3 is never the shortest of the three impulse waves 1,3, & 5 and
- Wave 4 never enters the price territory of wave 1
Currently, as per this labeling:
- wave 1 is approximately 74 points
- wave 3 is approximately 63 points
- wave 5 so far has traveled 55 points
Wave 5 low was 9462. So if wave 5 travels a little more than 63 points (that is above 9525 level), then we will have a situation where as per this labeling wave 3 would be the shortest. This would imply violation of rule 2 above. Ultimately this means that this labeling is incorrect. Instead the Nifty high we have labeled as wave 3 may be labeled as wave (i) of 3. Also instead of assuming we are in a wave 5 (in the short term charts) we should may assume that we are in wave (iii) of 3.
The short term implication is that a break of 9525 level on Nifty should be seen as a sign of higher levels ahead probably towards 9600 (may be more). On the downside 9461/9428 become very important support levels for the short term. We shouldn’t be looking for a major correction as long as we stay above the 9461 level.
This example illustrates how Elliott Wave Theory has an edge over classical technical analysis:
- Classical Technical Analysis revolves around important levels & indicators, but doesn’t provide different means to determine if a particular support or resistance may work in one instance or not. Elliott Wave Theory is often able to predict if a support or resistance level that worked in the past may work again or not.
- In markets like the one we are dealing with (i.e. one where Nifty is trading in never seen before zone), classical technical analysis has limited tools to identify important levels & targets. But using the Fibonacci price relationships as suggested by Elliott Wave Guidelines, one may be able to get a sense of the extent of next possible move.
- More importantly Elliott Wave Theory provides a way for incorporating price structure of the move (like the kind of analysis we presented in this article). This price structure may often help one to incorporate new price information. This in turn helps in confirming one’s original analysis. It also helps in identifying developments that may significantly alter one’s forecast.
The reader though (specially the long term investor) may question that if a high probability bearish forecast may turn into a high probability bullish forecast (in a space of 25 points in this case), how should one use this theory to better manage the portfolio. This problem is solved by trading (or investing) in the direction of the higher degree trend. So for example in our last update we clearly mentioned how the long term trend is up for Nifty. So it would make little sense for a long term investor to actively try and position his/her portfolio to capture every correction (unless it is a higher degree correction of say 1000 points or so). In fact for individual stocks, the price structure (& wave counts) in the individual stocks should be given the most importance. Hence, individual stocks should be traded based on their individual price structures. The longer term Nifty (or Sensex) index price structure can be used as a tie breaker if there are 2 or more possible wave counts for a stock. Of course Identifying the longer term trend also helps one in passive investing via mutual funds or index funds.
So it is important to analyze at the right degree depending on your time frame of trading/investor. A short term trader may look at 15-min, 30-min, 60-min charts. While a long term investor may look at daily/weekly charts. You may occasionally need to toggle from one time frame to another, but depending on your trading/ investing horizon tracking the price structure using elliott wave theory can make/save you a lot of money.
While it is not possible for me to update the blog every day, this analysis here is meant to underline the importance of learning the theory yourself to utilize it as per your own needs.