Since our last post Nifty has managed to keep its upward momentum intact without any major correction, except the one today. This correction has developed around an important trend line (T1) as shown below:
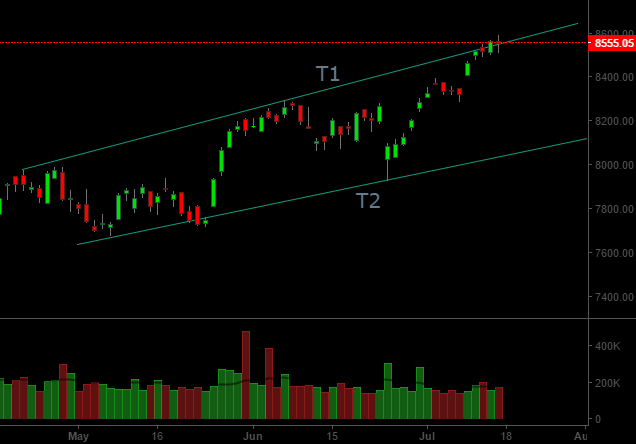
This trend line (T1) should be closely observed as we would need to witness substantial strength above this trend line in order to expect much higher levels. The correction we are seeing may be markets way to prepare for a boost upward. But for this to materialize the correction should preferably manage to stay above the crucial 8478 level. A break of 8478 may require us to examine the price structure to see if we may see a deeper correction. On the upside we wait to see if the current momentum is strong enough to break the crucial 8655 level. This would be the ideal time for markets to develop ‘wave extensions’ which would imply at least a couple of major upmoves like the one we have seen since brexit.
We have been constantly saying that in this scenario it would be wise to weed out the under performers. A question naturally arises: If it is still a good possibility that we may see a major fall then why should one not sell off all the stocks? It is not just because of potential returns we may gain from further up moves in the general market. It is also because a stock’s bottom may not necessarily coincide with stock index (Nifty/ Sensex) bottom. To illustrate this point. Here are charts of some of the stocks that made their bottom before Nifty or Sensex bottomed out:
PTC India
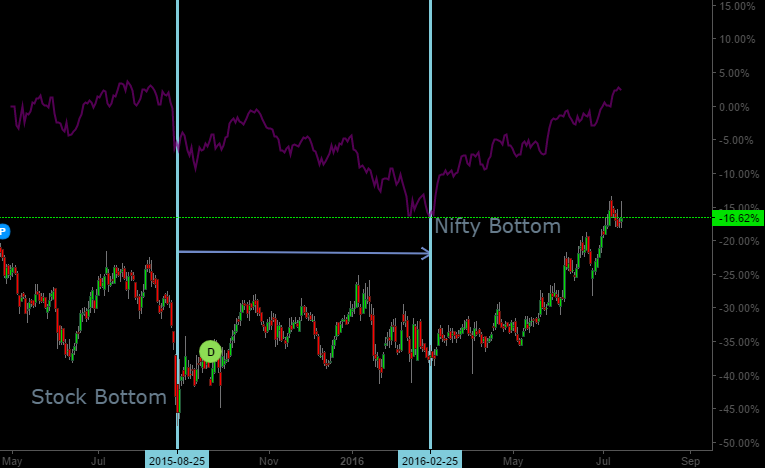
By looking at this chart you can see that the stock bottomed out around 25-August-15. While the Nifty bottom didn’t arrive until next 6 months. Also consider this Nifty was at 7880 when PTC India made its bottom and closed at 8541 on 15-July-16. So Nifty returns over the period was 8.3%. In the same period PTC India moved from around 50 to 80. Thus returning approximately 60%. If a stock displays out-performance during bad times, that is it stops making new lows while the stock indices are making new lows, its display of relative strength implies that as the market conditions improve, it is likely going to provide much better returns than the general market. Lets look at another example:
Uflex
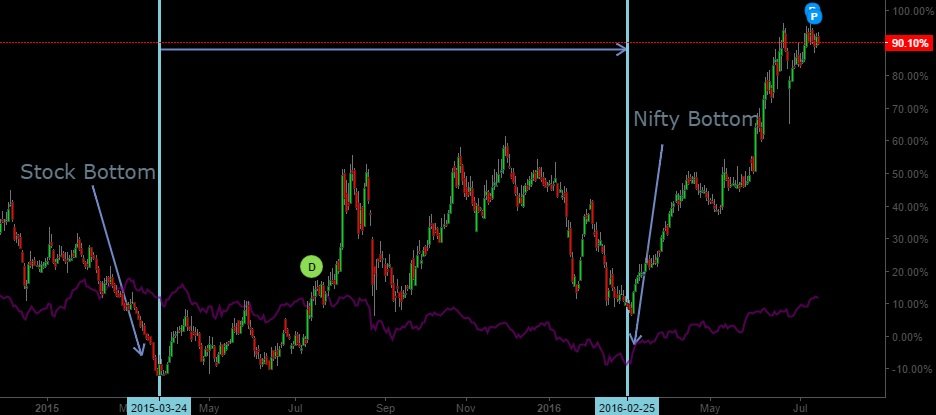
Uflex bottomed out around 24-March 2015. Nifty bottomed out after 11 months in late February. Nifty closed around 8543 on 24-March 2015 (The day Uflex made its low). On 15-March-2016, Nifty closed around 8541. Hence over this period Nifty has returned close to 0%. But Uflex closing price on 24-March 2015 was around Rs. 114, while its price on 15-March was around 237. Thus yielding close to 108% returns over the same period.
These examples signify the following:
- If your stock performs relatively better during bad times. It will likely outperform the market as market conditions improve. The converse is also true, if you stock performs relatively poorly during good times, it is likely going to severely under perform during bad times. (Hence our weeding out under-performers recommendation)
- A stock’s bottom may not necessarily coincide with Market indices’ bottom. So you may not necessarily get a better price on a good stock, even if there is a major fall in the markets.
- Every stock moves as per the collective sentiment of participants trading that particular stock. Hence each stock should be analyzed (technically) separately from the general market (represented by the stock index). Good times in the stock market may act as a tailwind, while bad times in the stock market may act as headwind. However general market condition alone only amplifies or mitigates an individual stock’s performance. In the long run it is the stock’s own performance that determines if it creates value for the investor.
Disclosure & Disclaimer: I own some of the stocks discussed in this post. This is not an investment recommendation and the stock charts have been shared for educational purposes only.