Just Dial got listed only around second half of 2013. Which means trading data is only available since. This makes the data set incomplete as far as application of elliott wave analysis is concerned. But if you can get hold of basics, you can still find ways to make profitable trades. In this article we take the example of Just Dial to demonstrate this.
As per Elliott Wave Theory any freely traded asset would move in waves. These waves would be impulse waves or corrective waves. Impulse waves are followed by corrective waves & vice versa. The key difference between impulse and corrective waves is that impulse waves are fast moving and the same price is not retraced many times during the wave. In contrast in case of corrective waves you may find that the same price gets traded quite a few times before the prices move away from the price range. In case of complex corrections this would mean that you will have phases where prices trade in a range (thus retracing same prices over and over) and then there would be a sudden move and a new range will be established before prices move again as part of the correction. This also means that while it is relatively easy to identify clear wave counts for impulse waves, identifying clear wave counts for corrections is challenging.
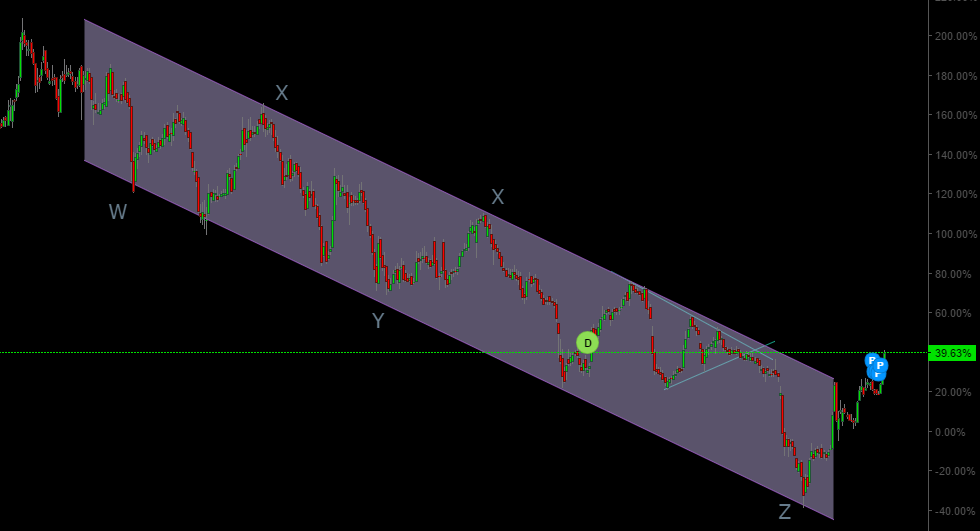
But in certain situations you can still apply the basics and identify important turning points, as happened in the case of Just Dial. Below is the chart of Just Dial where I have market the complex correction.
Now say one is not sure of the wave count for this complex correction. Is there still a way one could have identified when a major rally might begin. Turns out Yes! If you could remember that often complex corrections are contained in trend channels & that the triangle pattern develops just before the last move in a trend before the trend reverses. As you can see in the chart above there is a triangle formation followed by a 5-wave downward sequence that is relatively easy to identify. To top this the entire correction has been contained in a trend channel. Once prices bounce off the lower end of this trend channel and develop a 5-wave upward move of lesser degree. This is a clear indication that we may have a case for a sustainable up trend.
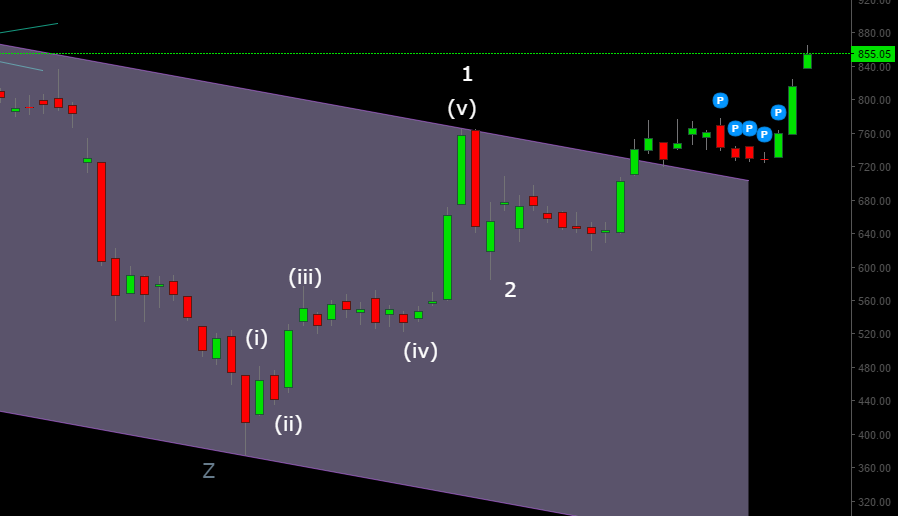
To be sure taking this trade would still seem to be a high risk trade because the prices had been in a downtrend for close to 18 months. So in such scenarios it also helps to know what you are buying. The fact remains that it is a debt-free profitable company now trying to build up presence in e-comm. where most other companies are relying on external funding. It has seen slower growth, lower OPMs, but is still the leading local search engine for services, and while this doesn’t mean that the company should command a P/E of 80. Surely at the end of this correction it was trading closer to a P/E of 15, and that is not nearly as expensive. Given these factors combined with the extreme bearish sentiment, a correction of close to 80% from its peak values, and our elliott wave analysis still made a compelling case for buying the stock. The price developments since then have only been positive as shown in the expanded chart below:
The prices have rallied in a 5-wave upward sequence completing wave 1. Prices corrected right from the upper end of the trend channel in a wave 2 . The prices may now be trending as part of a wave 3 up move which is likely given how easily prices broke through a trend channel which had held for 18 months. As part of wave 3 though the prices should be able to hit 1170 (assuming our analysis since the lows is correct). The price action needs to carefully watched for developments that may prove our analysis wrong.
This though demonstrates how even in face of incomplete data, elliott wave analysis can many times powerfully guide you to substantially wonderful results. If chart of a stock does not make sense though, you still have the option to look at other stocks for opportunities 🙂
Disclosure: I own some shares of Just Dial. This example has been share for educational purposes and is not a trading or investment recommendation.


