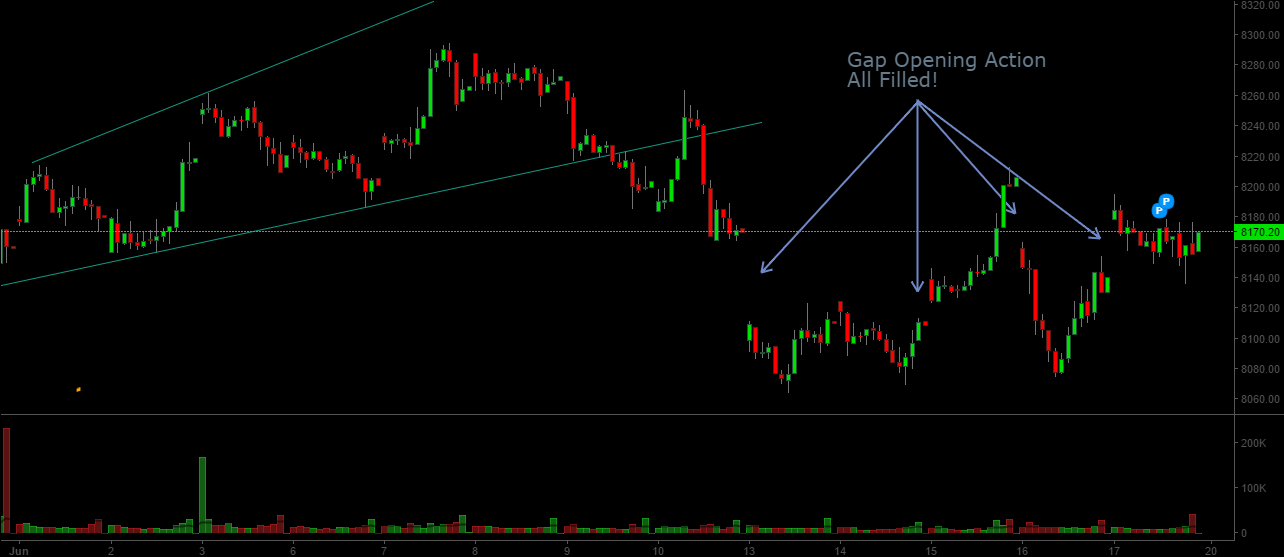
Nifty & Sensex managed a volatile week which was characterized by sharp gap opening actions. For 4 out of 5 days we saw indices open gap down or up. Characteristically all these gaps were subsequently filled. This points to these gaps being area gaps which indicate some kind of congestion pattern formation in play. Chart Below:
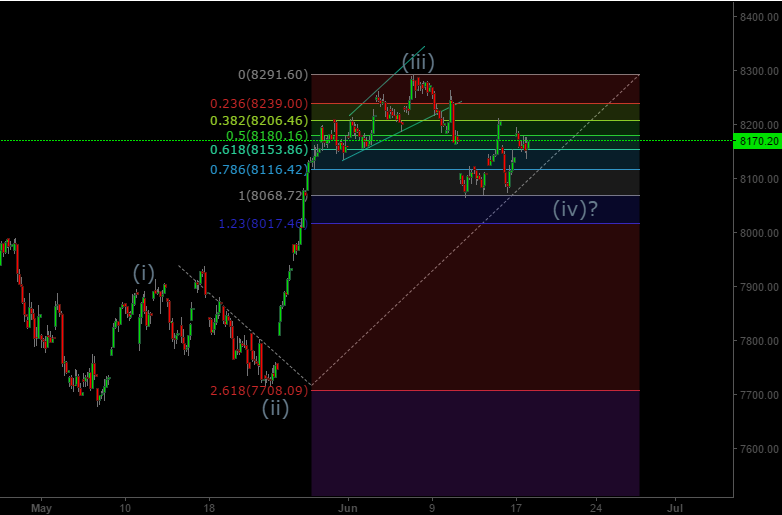
We are presenting below another chart with short term wave count for Nifty. From the formation of area gaps it is highly likely that we are in minuette wave (iv) correction which may take the form of a flat or a triangle. This correction magnitude wise is already of the same magnitude as the correction we saw in May. Hence the level of 8068 would become a very crucial level for Nifty. This is specially true if wave (iv) is playing out as a triangle pattern.
This correction should ultimately resolve to the upside, but the upside here may not be as big as the one we witnessed from May lows. The rally from May lows saw a rally from 7716 to 8291 ( around 575 points). The magnitude of the next rally after the present correction completes itself may be noway near this magnitude. It is very likely the next rally may be closer in magnitude to (i) as per wave equality guideline, which would imply a move of around 220 points from the point the corrective wave (iv) ends.
Key to also remember is that we have Brexit vote around the corner. Brexit is widely being seen as a major risk to the world economy. So would a Brexit outcome necessarily result in a negative outcome in the financial markets? Probably as per fundamentals, but the fundamentals can often be used to justify completely opposite price outcomes. Consider the following hypothetical scenarios and news headlines (also hypothetical):
- Brexit materializes and markets go down. Headline reads: “Markets go for tailspin as Brexit clouds world economy”
- Brexit materializes and markets go up. Headline reads: “Markets up as Brexit raises odds of further easing by central banks”
- No Brexit and markets go up. Headline reads: “Markets up as UK votes to stay in Euro Zone”
- No Brexit and markets go down. Headline reads: “Markets down as No Brexit raises odds of further rate hikes by Federal Reserve”
As you can see all price outcomes post Brexit can be justified by “Fundamentals”. In such a scenario how can one objectively trade by looking at the news or only based on fundamentals? This is where Technical analysis holds an edge over Fundamental analysis because it forces you to take into account the only reliable objective data available in the financial markets: Price & Volume. As far as technical analysis and more specifically Elliott Wave analysis is concerned there are only two scenarios:
- Prices go down: If they go down in a corrective fashion expect a pop back up whether or not Brexit materializes. If they take an impulse move down and break through key levels mentioned in our last post. We know we have much more pain ahead.
- Prices go up: If they go up they would again do so in line with the expected wave count scenarios we have highlighted in our recent posts and we are back to tracking only price and volume.
In light of the analysis as per our recent posts if a rally materializes it would be a good opportunity to weed out under performers in our portfolio and only hold on to winners as we track short term wave counts and see if the prices actually manage to break through the key level of 8655 as per our last post.
As we close this article, the news of Rexit has come in: Our rock star RBI governor Raghuram Rajan will be returning to academics and won’t be reappointed as governor in September. Good enough news for sell off? Fundamentally, may be Yes! But doesn’t his exit pave way for more aggressive rate cuts too? Potentially Bullish for the markets? As you see there are two interpretations that can be used to justify a bullish or bearish move. Hence we are better off watching the key levels mentioned in our recent reports to decide the medium term outlook for Nifty/ Sensex.


