NIFTY POST BUDGET ACTION
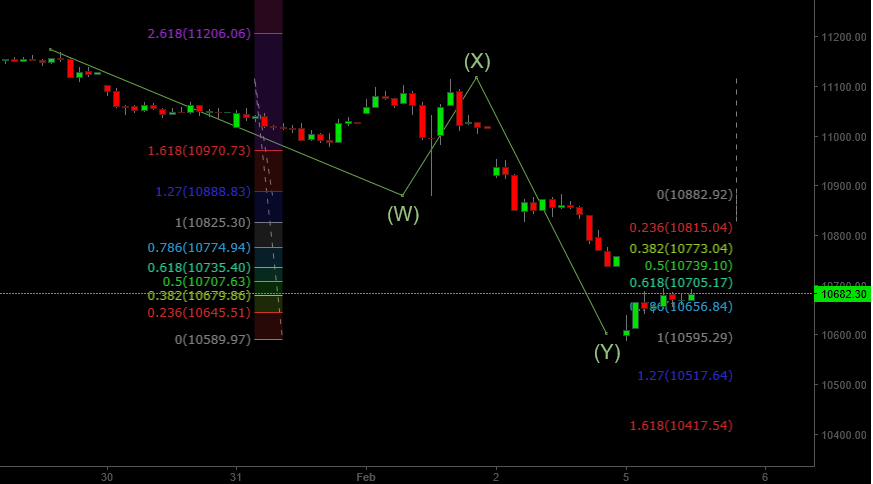
Nifty has seen substantial fall from highs of 11170. I am seeing this current fall as part of a double zig-zag correction so far. Though my confidence on this would only increase if we see prices closing the gap down action seen today. Nifty 30-min Chart Below:
Important short term resistance for Nifty is at – 10829 followed by 10880. Important short term support is at 10592, followed by 10550.
Important long term support stands at 10490. From the price action seen so far, I don’t see a need to alter our long term bullish view on the Indian share markets, as of now. Specifically we would like to see a 5-wave downward impulse move followed by a correction that fails to take out the highs of Nifty for us to consider a long term change in trend.
NIFTY DAILY COUNT
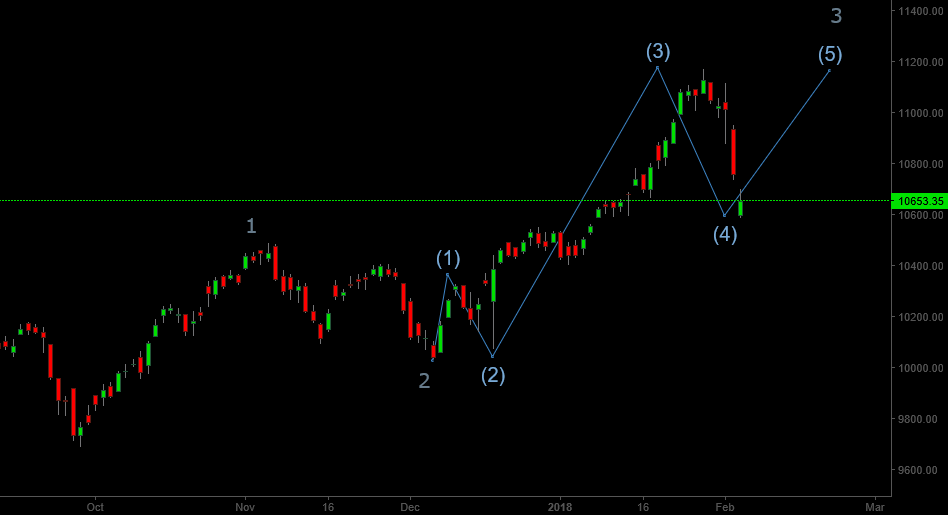
Here is the current wave count I’m tracking on the daily charts:
As per this chart I’m seeing current fall in Nifty as part of (4). We can continue to do so as long as we stay above the wave (1) high of around 10329. The wave (2) high to low lasted for 6 days. If we are indeed in a wave (4) time wise we are also in the 6th day of the fall today. So time wise we are indeed at an important juncture. The problem though is with the depth of the correction. Typically you expect wave (4) corrections to retrace around 38.2% of wave (3). In our case we have far exceeded this level. We would have far greater confidence on an immediate bullish move if we had both the time and price Fibonacci tools co-coinciding. This however is not the case.
In such a scenario it would be best for us to wait for some concrete positive price developments to happen before turning bullish. Any bullish trades otherwise would be highly speculative.


