Nifty Elliott Wave
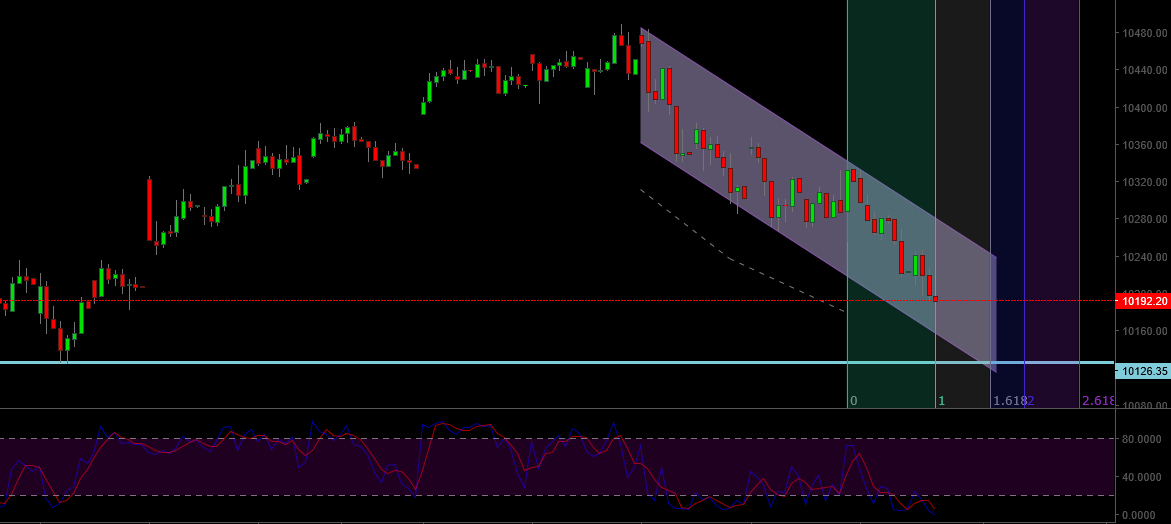
Nifty hit a high close to 10500 since our last update and we have seen a substantial downward move since. Prices are still trading above the crucial 10104-10120 gap area we mentioned in the last post. This crucial gap area will continue to remain an important support zone. The 10125 level is the key level from which the rally to 10500 started, so this becomes a very important level.
Nifty 60-min Chart
Fibonacci Price & Time wise we have entered a crucial zone (not shown). But, the price substructure of the down fall is not very clear. Hence, its important to wait for positive price developments. I have shown a downward sloping channel that should continue to hold if the down move from close to 10500 level is a corrective move.
A break above the upper line of this trend channel would indicate that the correction is probably over and we are headed towards new all time highs on Nifty. Important resistance levels are at 10268/10344. Important support may be anticipated around 10183/10125 levels.


