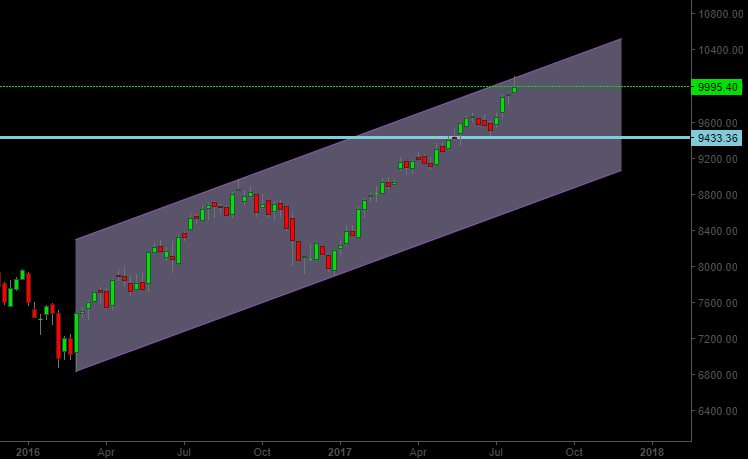
Nifty has developed some sort of correction from the upper line of an important trend channel. Chart Below:
This trend channel is based on Nifty’s 2016 budget lows and demonetization lows. Our working assumption based on elliott wave theory wave count for Nifty & Sensex is that we are probably in a strong wave 3 at multiple degrees. This trend channel will be another way for us to confirm our assumption.
Specifically, if our working assumption is correct Nifty should be able to break out from this trend channel to the upside. A concept from elliott wave theory: “In case of impulse waves we can form a tentative trend channel by drawing a line by joining lows of waves 1 and 3 (in an uptrend). We can draw a parallel line to this line that passes through wave 1 high.” In case of an impulse wave we expect the wave 3 to be able to break above this trend channel.
As per elliott wave theory corrections are often bound by two parallel trend lines, and are unable to sustain above the upper line of the trend channel in an uptrend (or below the lower line of the trend channel in a downward correction). If you are a regular to our blog you might recall how this technique helped us position ourselves correctly around the Feb-March 2016 lows around 7000 in Nifty. Since the current scenario is similar (except that this is an uptrend channel v/s a downtrend channel of 2015-16), it is extremely important for us to see the prices break above the trend channel to get continued confirmation of our working bullish wave count of longer term.
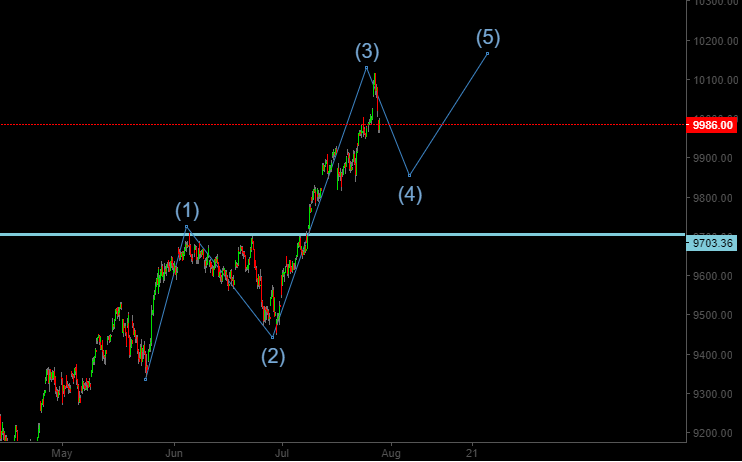
From a short term perspective, Nifty may potentially correct to 9857 level (38.2% retracement level) as part of minutte wave (4). This correction may develop as a flat or triangle (or a more complex correction). Once the correction completes we may expect the markets to attempt to take out the recent highs of Nifty. This wave count would be invalid if we break below the wave (1) high around 9700 level. Nifty hourly Chart Below:


