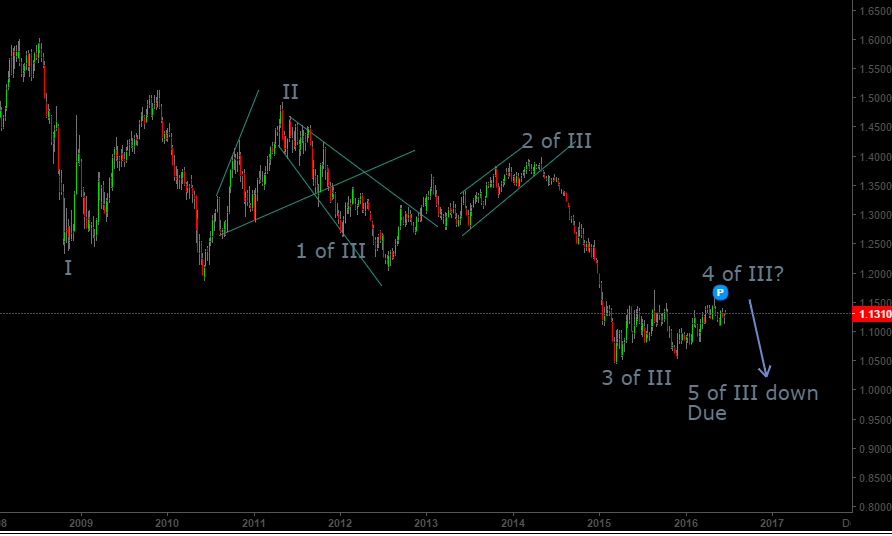
Here is the long term EURUSD elliott wave count:
The wave count tells us that we are in a long term wave III down trend. Wave 3 within this wave was very close to 1.5 times the magnitude wave 1. The rally in EURUSD since 2015 is part of corrective wave 4 of III. At the end of wave 4 (and there is a possibility that wave 4 is already over), we should expect wave 5 down to begin (or might already have). We should expect wave 5 to be of same magnitude as wave 1. To put it in numbers: wave 1 was of 2300 pips. The upcoming fall which might take months (if not years) to unfold would be of a similar magnitude. Hence one should expect the next long term move to carry Euro well below parity.
Since EURUSD has the highest weight in Dollar Index. This is well reflected in Dollar Index charts as well. Below is the chart of dollar index: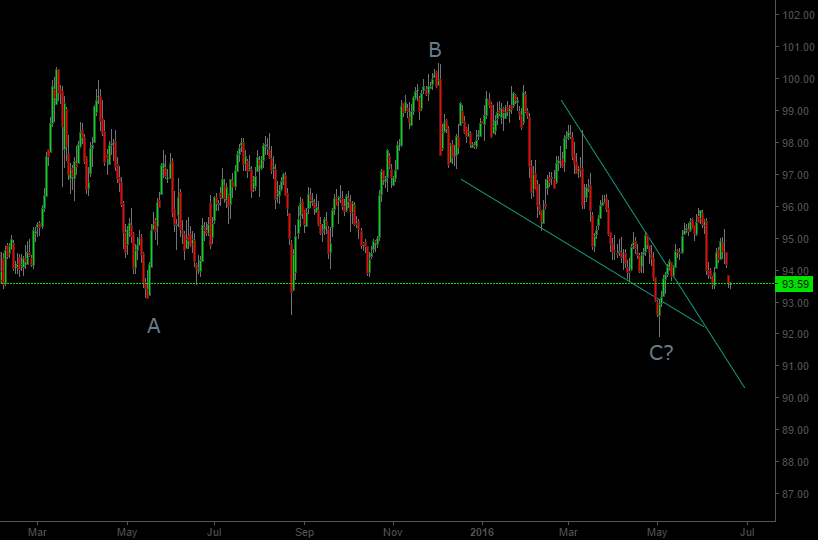
The wave count so far has been characterized by symmetric behavior. Wave B was close to 1.1 times Wave A. The wave C fall till May is also close to 1.1 times Wave B. If wave C has worked out as a diagonal triangle then the worst may already be over for dollar index. Specifically the level of 93.42 proved to be a tough break for the index as the index quickly covered the down gap created at the open on 21-06-16. Hence odds are high that the level of 91.88 may mark the end of wave C and we may see a level of 100 (and substantially higher) before we see 91.88 again.
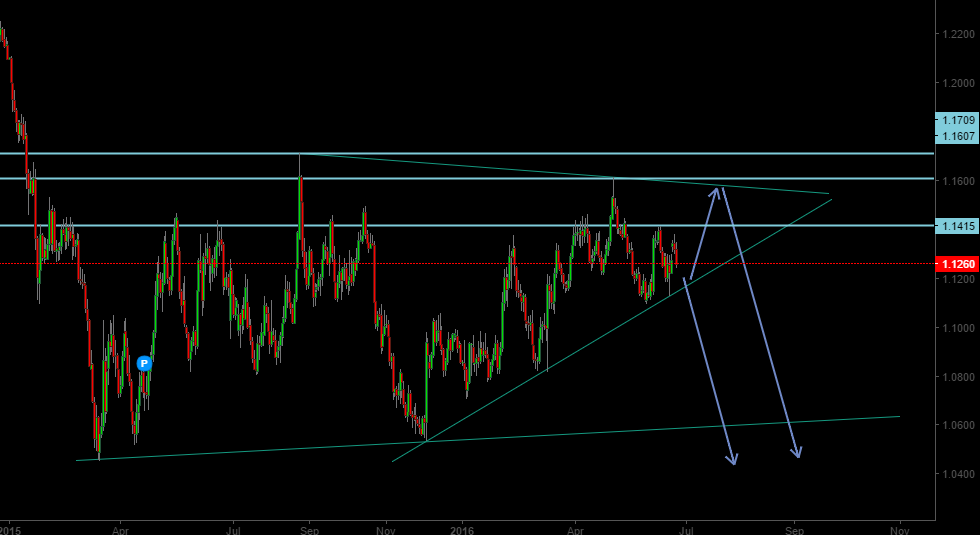
Below is the chart for EURUSD. Showing the wave 4 price action:
Essentially wave 4 is either a flat or a triangle. Either way prices will likely not carry beyond their April highs of 1.1616. This is specially true if the wave 4 is playing out as triangle. On the downside a break below 1.1096 would mean an immediate downfall to begin towards 1.06 and possibly below as part of wave 5. In that respect it is very clear that the outcome of the referendum may only determine whether prices go down immediately or they go down after popping up (as part of a likely triangle correction).
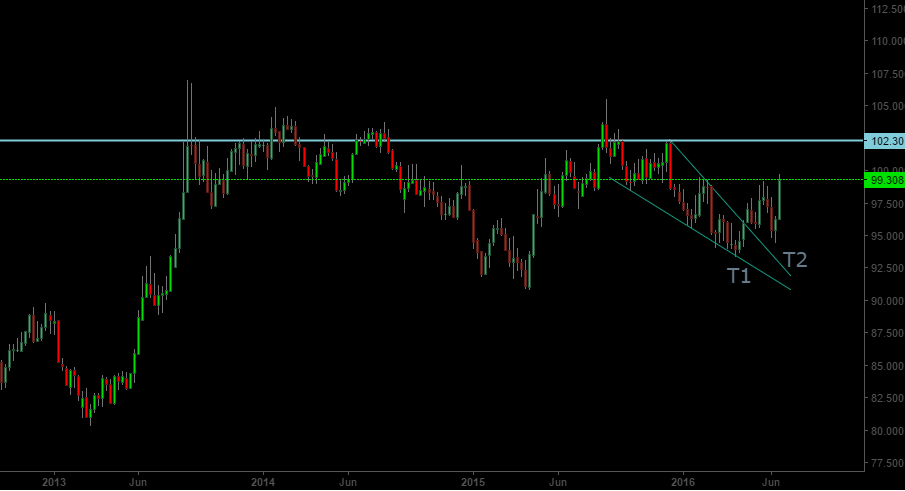
Below is chart of GBPINR:
We have been bullish on GBPINR pair since April. This is specially because GBPINR was able to break through the T2 line shown above. It subsequently was able to survive a scare fall in the currency pair, which did not lead to a new low. The prices look set to touch 102.30 and possibly cross 105.
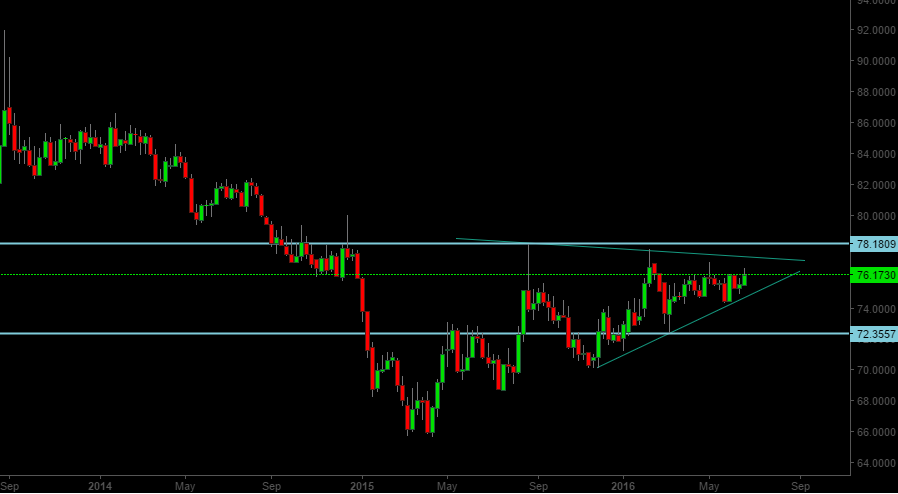
Below is the weekly chart of EURINR:
EUR INR is one pair which is currently most difficult to call. This is largely because of likely extreme opposing tussle between EURUSD and USDINR. The likely move would depend on which currency pair will be able to dominate the outcome. Before August 2013 a new high in USDINR was usually accompanied by a new high in EURINR. This was probably because USDINR was able to dominate the outcome. But since August 2013 this is no longer the case as the fall in EURUSD has been so extreme that even USDINR weakness has not been able to support Euro against INR. We think this trend is likely to continue, but the level of 78.18 is the key level which would determine if the prices can rally further. In fact as long as this level holds we can expect an immediate fall towards early May lows. A break of this level may however temporarily postpone this eventuality.
Below is the chart for USD INR: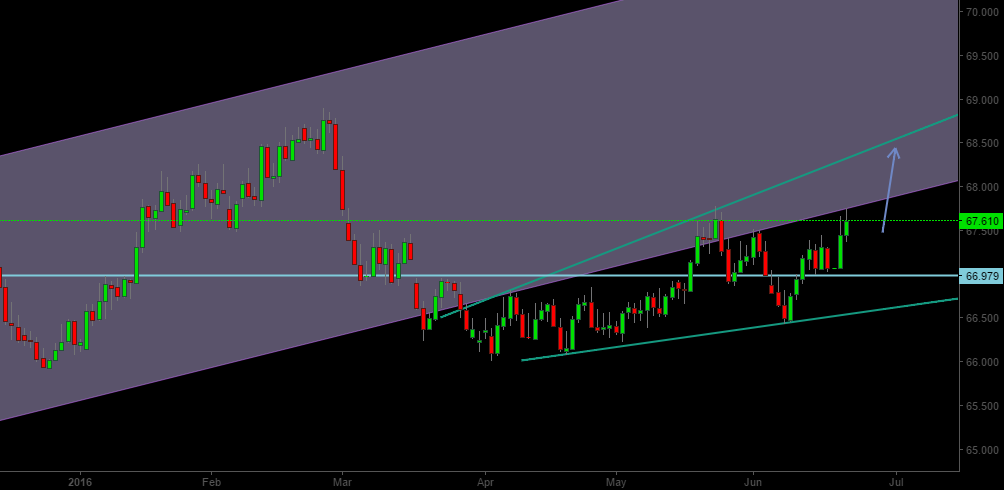
Level of 66.99 holds the key for USD INR. From the price structure it looks likely that we are headed for a test of 68.50 which should likely get some resistance at the upper trend line. This also means that USD INR will again briefly enter the upward sloping channel which it broke in March 2016. Considering the bullishness expected in Dollar Index it would be very difficult for USD INR to not make a new high if the bullish move in DXY materializes. In fact it is looking increasingly likely that INR may weaken in months to come and break above its March 2016 highs.
PS: If you like our analysis do remember to share this post with your friends using one of the social buttons below.


One thought on “EURUSD: Fate is sealed. Brexit or Not!”
Comments are closed.