Once in a while markets approach levels that have the capability to define the trend for the market for coming weeks or months. Something similar seems to be happening in crude oil as it approaches an important zone which may provide a decisive hint to the the next major trend its price.
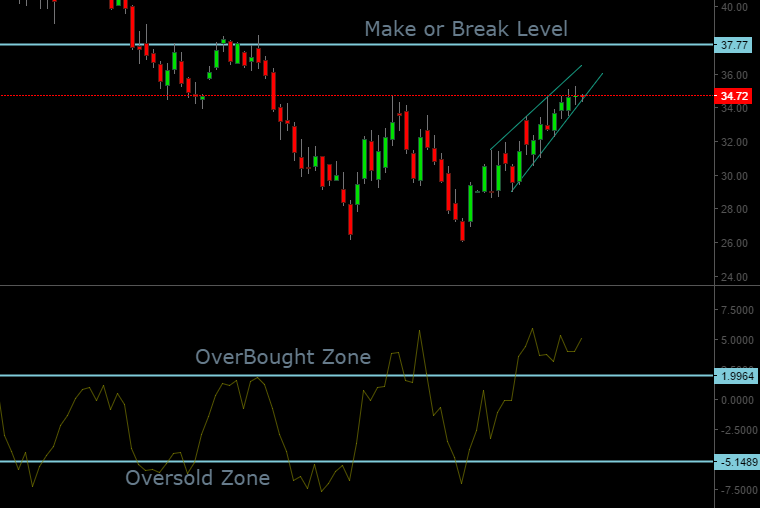
Below is a chart for Nymex Crude Oil:
The prices are trading in a congestion zone for last few sessions, and should afford to resolve themselves either way. The level of 37.75 might prove to be a decisive level and if the prices reverse from below these levels the resulting fall may reverse the entire gains since Feb lows of 26. The fall may have the power to take prices much lower very fast. The first hint of the fall may come from the break of the lower trend line in the congestion pattern.
However a break of 37.75, would drastically change the scenario and we may have a rally extending for quite a few weeks. We also note that the momentum oscillators are in an overbought zone ,which may traditionally prefer the bearish scenario over bullish scenario. But as we always say prices should be the main deciding factor in the upcoming move, and the importance of second order indicators is lower.
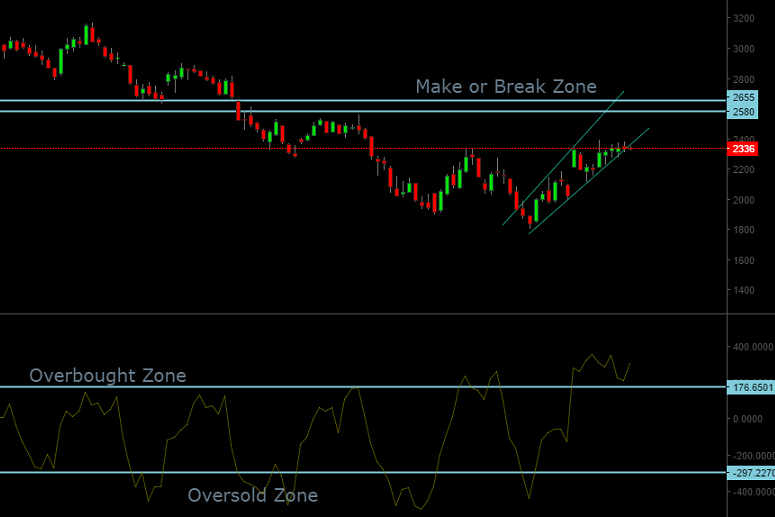
Corresponding zone for MCX crude oil is 2580-2655 zone. The implications for this zone are exactly the same. Chart below:
One thought on “MCX Crude / NYMEX Crude approach Make or Break Zone”
Comments are closed.


Amazing analysis. Thanks for this Yash.