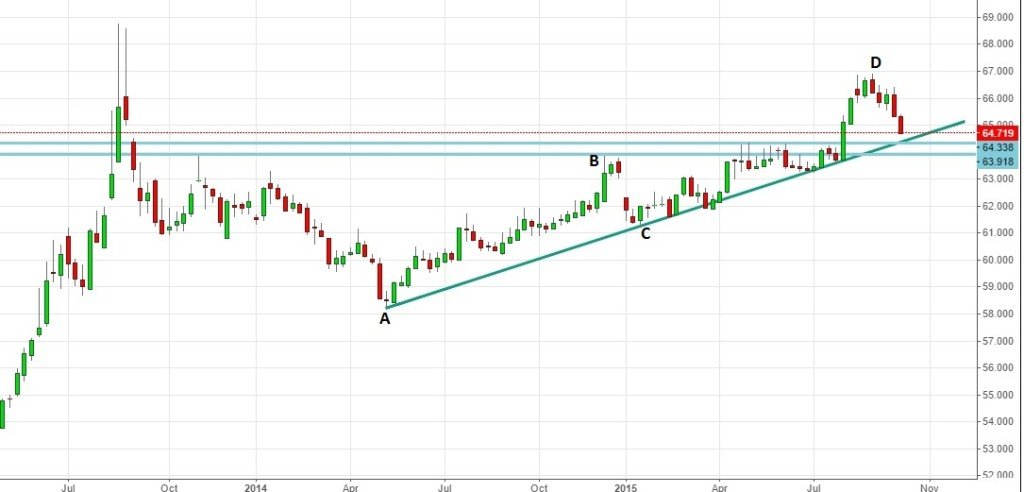
USDINR approaches make or break price range that would decide its trend for coming weeks may be even months. A break of this price range would signal bearish trend however if it manages to hold above these levels (which to us looks unlikely) the prices would likely test the 2013 highs for the currency pair around 68.8, but at a minimum one can expect it to go to the more recent highs around Rs.67.
For ease of analysis we have marked important recent price highs /lows with annotations A,B,C etc.
As shown in the chart the price range of 63.89 to 64.39 is a crucial support zone. As prices approach this zone one could also expect support from the trend line passing through A-C. Any bullish trades should be around the support zone on the trend-line with stops below 63.89. We however see it more likely that the prices would be able to break through these levels.
Primary reason for our belief is the magnitude of price moves A-B and C-D. The price move A-B entailed movement from 58.25 to 63.885 (approximately 5.6 Rs.), while the price move C-D entailed price movement from 61.25 to 66.91 (approximately 5.66Rs.) So, we see that A-B and C-D are of approximately equal magnitude. This often happens to be the case with corrective moves, which gives us the confidence that we may see break of this trend-line. If this were to occur and the prices manage to break through our critical range between 63.89-64.39, one should be progressively looking at 62 as the short term target, with further move to Rs. 59.8.
Next few days would be very exciting for the USDINR pair.


