Nifty violated many of the important levels mentioned in our last report. The sharp gap down movements in consecutive days pose a challenge in directly analyzing the price action (because of areas that lack any price action). In such a situation we will need to look at multiple time frames to gauge important levels and get a sense of probable next move.
Bullish Scenario Possibility for Nifty
In spite of the current steep fall, their is one scenario that still allows for a major bullish outcome (with minor modifications to the wave count). I would call it our most bullish wave count in the current scenario. The same is outlined in the chart below:
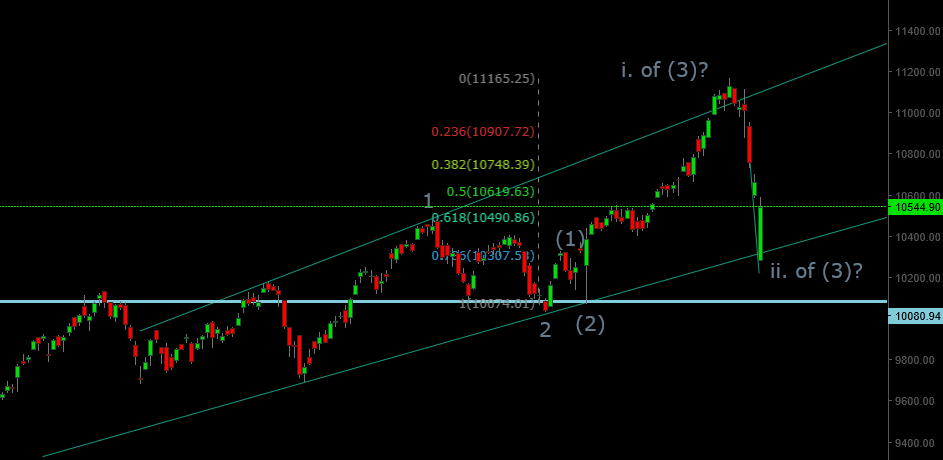
The make or break level for this scenario is 10033-10075 zone. A violation of these levels would negate this wave count. The current bounce in equity markets also seems to be happening from the 78.6% retracement level (from wave 2 lows) and also from a trend line joining start of waves 1 & 2. This is an encouraging sign, however the nature of the following price action (impulse/ corrective) would be important. At this nascent stage the recent lows of 10288 followed by 10033-10075 zone are important from a long term perspective.
Fibonacci Analysis of Nifty Bounce from Lows
Now let’s look at the short term bounce from the recent lows:
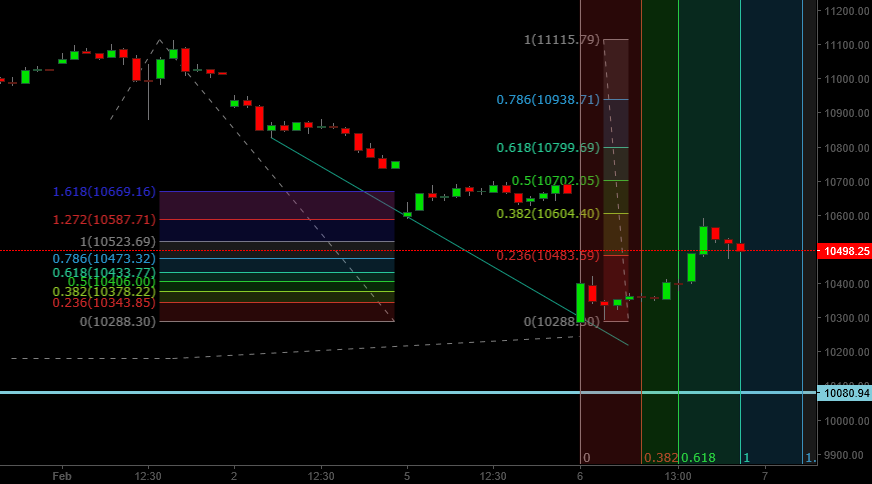
The bounce from lows of around 10290 has made an intraday high very close to the 38.2% retracement level around 10604. This also comes very close to the 1.272 times fibonacci level of 10587.71 (based on previous correction in the fall). Time wise too the bounce from 10290 has reached time parity with previous correction of similar magnitude. The implication is that if Nifty has to have another leg down, price & time magnitude wise this confluence of price & time would be the ideal place for the fall to begin. In contrast if we are able to sustain above this level, odds would be high that the worst is over in terms of downtrend (though the price sub-structure would need to be watched closely).
Nifty fall comparison with previous corrections
Here is the weekly chart of Nifty:
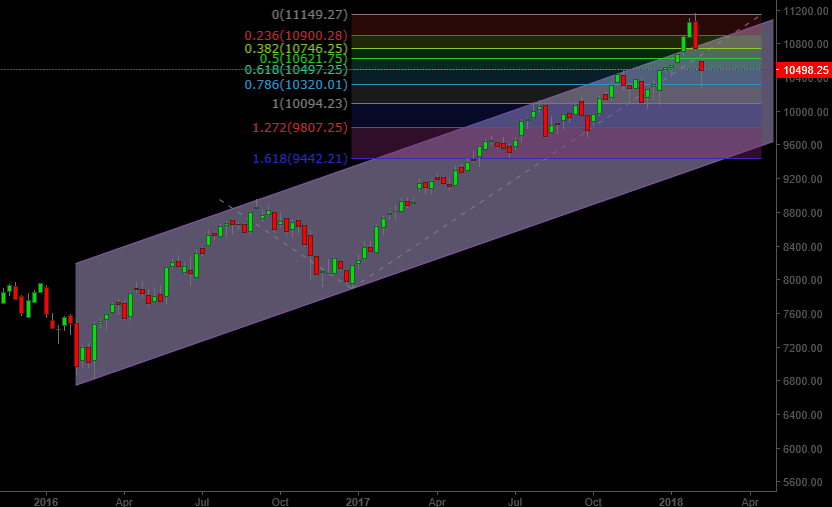
We see that since the December 2016 lows, magnitude wise this is the largest correction we have seen. Magnitude wise the current correction has so far traveled close to 78.6% of Dec ’16 correction. The correction though has taken much less time (less than 2 weeks vs 16 weeks for December ’16 correction), which points to the possibility that the market may spend more time in the correction, if it is of the same degree. We will need to be open to this possibility considering the rapidness of the current fall. We expect further price action to confirm if this is a realistic scenario that might play out (if at all).
Conclusion
The best case scenario for Nifty is that we are in wave ii. of 3. It is very important that we don’t fall below the 10033-10075 zone for Nifty for this scenario to remain valid. We need to sustain above the 6-Feb 10600 highs with a positive price structure to rule out the possibility immediate test of recent lows.