Nifty witnessed an unexpected sharp fall on 13th October. In the process Nifty briefly fell below the 8570-8600 zone and has been trading in the zone since. In spite of the sharp fall, the broader price action witnessed so far is indicating that this fall is probably a correction in the otherwise bullish trend we have been witnessing since February. This is because the price action from the Nifty high of 8966 has so far failed to form an impulse pattern to the downside. This scenario will remain our top most scenario unless we see a breach of 8294 level or formation of an impulse pattern to the downside or ideally both. Chart Below:
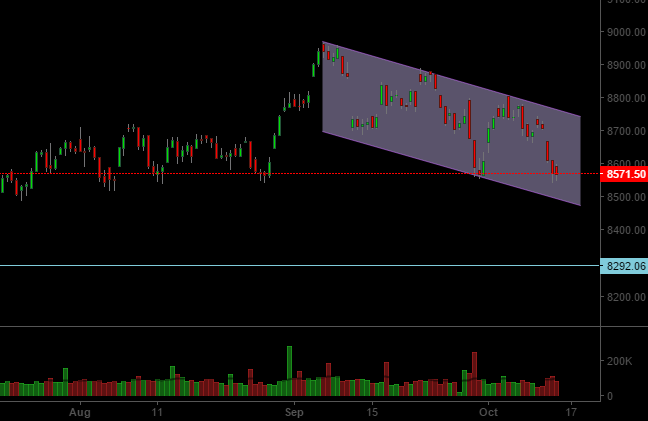
Corrections by their very nature are tricky to analyze and trade compared to an impulse moves. The price action in Nifty from 8966 can be labeled in many ways. This is usually because the market is still in the process of tracing out a definitive pattern. In such a scenario it becomes crucial to wait for the market to trace out the pattern. In the meanwhile we believe that if we are witnessing a correction we should probably be able to stay in the trend channel shown in the charts.
We have shown below a couple of ways to label this correction as per elliott wave theory (Though these are not the only ways we can label the current price action):
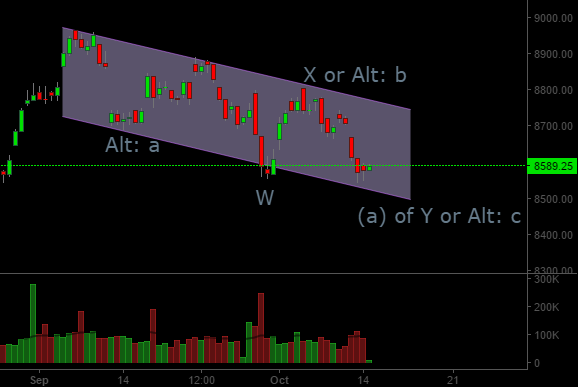
These labels represent our top 2 scenarios as of now:
- Our top scenario is to label the current correction as W-X-Y, where by we have completed the W and X wave of the correction and currently tracing out the Y leg of the correction. The Y leg of the correction would have to be sub-divided into three waves (a)-(b)-(c). We may be currently in the (a) leg and may next witness a (b) leg to the upside followed by another leg (c) to the downside which may carry prices to below the (a) leg low.
- The second alternate scenario prefixed by Alt: implies an a-b-c correction playing out. As per this scenario we may currently be in the c-leg of the fall. This is the more bullish of the two scenario as one may anticipate a major rally anytime if this scenario is playing out. Though we prefer the scenario 1 which would mean we spend more time tracing out the correction.
Unfortunately as already mentioned these two scenarios are not the only two possible scenarios currently, which is why we usually delay putting labels on elliott wave patterns for as long as possible. As the price action further evolves we may be able to narrow down our options. But for now we should not turn overly bearish unless we breach 8294 on the downside and form a downward impulse pattern in the process.
8488-8530 may be able to provide crucial support to the markets if another leg of the fall materializes as part of c-leg in scenario 2 or as part of (a) of Y in scenario 1. On the upside 8664 followed by 8806 are crucial resistance levels. If we are evolving as part of scenario 1 then we may not be able to cross the 8806 level before we develop another leg down. If scenario 2 unfolds we may see that the markets will be able to break through both the levels.