Markets had one of the worst days since April ’15. The news articles in non-financial media reflect this fact:
Snapshot from Times of India:

Snapshot from Firstpost:

Snapshot from Hindu:

Snapshot from NDTV:

If you have looked at these snapshots closely, you would feel something is wrong, and you would be right. These are not shapshots from today. These snapshots are from 20th of January, the day we issued this chart:
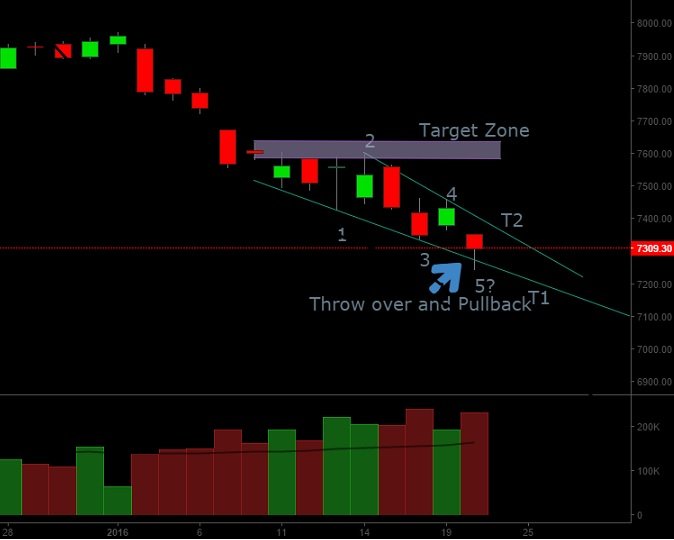
Non-financial news media running financial news is significant because it is an indicator of sentiment extreme. It usually occurs when the trend has over-reached to an extent that every one catches up with the trend. This results in non-financial media reporting the news as they perceive that the news is significant enough for everyone to know. This reporting by non-financial media serves as a good contrarian indicator. It indicates that the trend may be nearing an end or at least a temporary reversal . On 20th January, we had the non-financial media covering the market movement and we also had an ending diagonal pattern that had seen a throw over and pull back action indicating reversal in prices. The result was an over 350 point rally in Nifty towards our target zone.
Here is what the non-financial media is reporting today:
Snapshot from ToI:

Snapshot from NDTV:

Snapshot from The Hindu:

Chart of Nifty below:
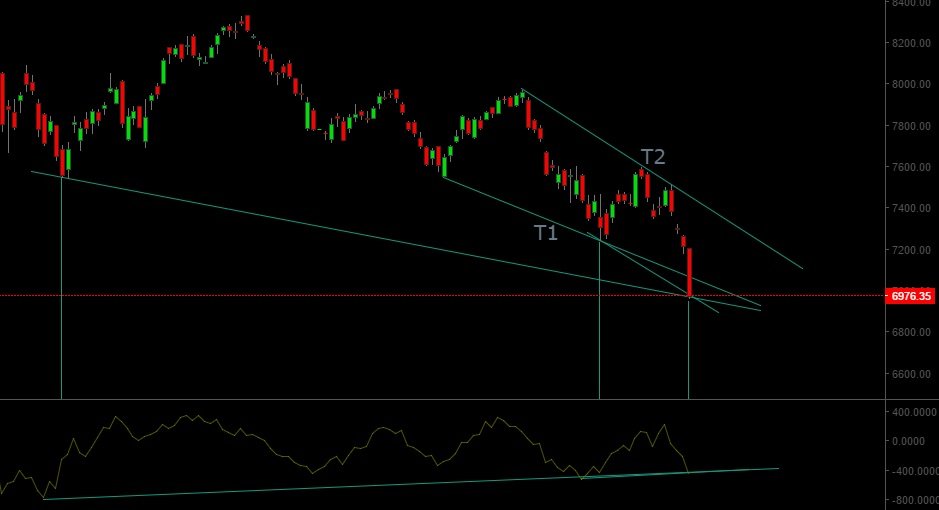
The charts are indicating divergence at multiple levels between momentum /macd indicators and prices as shown.
The ending diagonal pattern we were anticipating did lead to a test of the T1 line, but the prices have failed to reverse and close back above this trend line. In absence of any such move, no bullish conclusions can be drawn from this pattern for now. The prices though have reached close to an important 1.23 Fibonacci extension level (not shown). They are also trading near the lower line of our long term trend channel for the correction that has been in play since March ’15 (also not shown). A Friday close over the T1 trendline (around 7050-7070 levels) could be significant, as it would reflect a pull-back action on weekly charts for the ending diagonal pattern.
While the sentiment indicators and momentum indicators are aligned towards a reversal, until the price movements too confirm this reversal, we cannot act in anticipation of an upward move. Accordingly it will be prudent to wait for a price development that aligns with the sentiment and momentum indicators, before drawing any long term bullish implications.